
 Yahoo Finance
 Pressure Technologies (LON:PRES) Is Looking To Continue Growing Its Returns On Capital
Did you know there are some financial metrics that can provide clues of a potential multi-bagger? Ideally, a business will show two trends; firstly a growing return on capital employed (ROCE) and secondly, an increasing amount of capital employed. Basically this means that a company has profitable initiatives that it can continue to reinvest in, which is a trait of a compounding machine. Speaking of which, we noticed some great changes in Pressure Technologies' (LON:PRES) returns on capital, so let's have a look.
What Is Return On Capital Employed (ROCE)?
If you haven't worked with ROCE before, it measures the 'return' (pre-tax profit) a company generates from capital employed in its business. To calculate this metric for Pressure Technologies, this is the formula:
Return on Capital Employed = Earnings Before Interest and Tax (EBIT) ÷ (Total Assets - Current Liabilities)
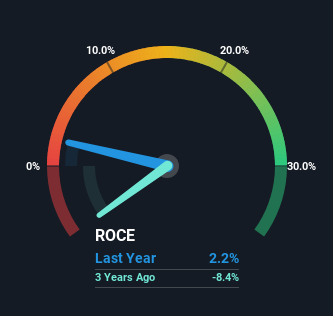
0.022 = UK£358k ÷ (UK£25m - UK£9.2m) (Based on the trailing twelve months to March 2024).
Thus, Pressure Technologies has an ROCE of 2.2%. Ultimately, that's a low return and it under-performs the Energy Services industry average of 9.9%.
Check out our latest analysis for Pressure Technologies
In the above chart we have measured Pressure Technologies' prior ROCE against its prior performance, but the future is arguably more important. If you're interested, you can view the analysts predictions in our free analyst report for Pressure Technologies .
The Trend Of ROCE
Even though ROCE is still low in absolute terms, it's good to see it's heading in the right direction. The figures show that over the last five years, returns on capital have grown by 62%. The company is now earning UK£0.02 per dollar of capital employed. Speaking of capital employed, the company is actually utilizing 65% less than it was five years ago, which can be indicative of a business that's improving its efficiency. A business that's shrinking its asset base like this isn't usually typical of a soon to be multi-bagger company.
On a side note, we noticed that the improvement in ROCE appears to be partly fueled by an increase in current liabilities. Essentially the business now has suppliers or short-term creditors funding about 36% of its operations, which isn't ideal. It's worth keeping an eye on this because as the percentage of current liabilities to total assets increases, some aspects of risk also increase.
The Key Takeaway
In a nutshell, we're pleased to see that Pressure Technologies has been able to generate higher returns from less capital. And since the stock has fallen 67% over the last five years, there might be an opportunity here. With that in mind, we believe the promising trends warrant this stock for further investigation.
Like most companies, Pressure Technologies does come with some risks, and we've found 1 warning sign that you should be aware of.
If you want to search for solid companies with great earnings, check out this free list of companies with good balance sheets and impressive returns on equity.
Have feedback on this article? Concerned about the content? Get in touch with us directly. Alternatively, email editorial-team (at) simplywallst.com.
This article by Simply Wall St is general in nature. We provide commentary based on historical data and analyst forecasts only using an unbiased methodology and our articles are not intended to be financial advice. It does not constitute a recommendation to buy or sell any stock, and does not take account of your objectives, or your financial situation. We aim to bring you long-term focused analysis driven by fundamental data. Note that our analysis may not factor in the latest price-sensitive company announcements or qualitative material. Simply Wall St has no position in any stocks mentioned.
Have feedback on this article? Concerned about the content? Get in touch with us directly. Alternatively, email editorial-team@simplywallst.com
