
 Yahoo Finance
 Can PNM Resources, Inc. (NYSE:PNM) Improve Its Returns?
While some investors are already well versed in financial metrics (hat tip), this article is for those who would like to learn about Return On Equity (ROE) and why it is important. By way of learning-by-doing, we'll look at ROE to gain a better understanding of PNM Resources, Inc. (NYSE:PNM).
ROE or return on equity is a useful tool to assess how effectively a company can generate returns on the investment it received from its shareholders. Simply put, it is used to assess the profitability of a company in relation to its equity capital.
Check out our latest analysis for PNM Resources
How To Calculate Return On Equity?
ROE can be calculated by using the formula:
Return on Equity = Net Profit (from continuing operations) ÷ Shareholders' Equity
So, based on the above formula, the ROE for PNM Resources is:
4.0% = US$96m ÷ US$2.4b (Based on the trailing twelve months to March 2024).
The 'return' is the yearly profit. So, this means that for every $1 of its shareholder's investments, the company generates a profit of $0.04.
Does PNM Resources Have A Good ROE?
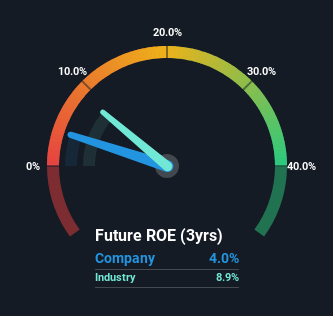
By comparing a company's ROE with its industry average, we can get a quick measure of how good it is. However, this method is only useful as a rough check, because companies do differ quite a bit within the same industry classification. As shown in the graphic below, PNM Resources has a lower ROE than the average (8.9%) in the Electric Utilities industry classification.
Unfortunately, that's sub-optimal. Although, we think that a lower ROE could still mean that a company has the opportunity to better its returns with the use of leverage, provided its existing debt levels are low. When a company has low ROE but high debt levels, we would be cautious as the risk involved is too high. To know the 5 risks we have identified for PNM Resources visit our risks dashboard for free.
How Does Debt Impact ROE?
Virtually all companies need money to invest in the business, to grow profits. That cash can come from issuing shares, retained earnings, or debt. In the first and second cases, the ROE will reflect this use of cash for investment in the business. In the latter case, the use of debt will improve the returns, but will not change the equity. Thus the use of debt can improve ROE, albeit along with extra risk in the case of stormy weather, metaphorically speaking.
Combining PNM Resources' Debt And Its 4.0% Return On Equity
PNM Resources does use a high amount of debt to increase returns. It has a debt to equity ratio of 2.02. Its ROE is quite low, even with the use of significant debt; that's not a good result, in our opinion. Debt does bring extra risk, so it's only really worthwhile when a company generates some decent returns from it.
Summary
Return on equity is one way we can compare its business quality of different companies. In our books, the highest quality companies have high return on equity, despite low debt. If two companies have the same ROE, then I would generally prefer the one with less debt.
But when a business is high quality, the market often bids it up to a price that reflects this. The rate at which profits are likely to grow, relative to the expectations of profit growth reflected in the current price, must be considered, too. So you might want to check this FREE visualization of analyst forecasts for the company.
If you would prefer check out another company -- one with potentially superior financials -- then do not miss this free list of interesting companies, that have HIGH return on equity and low debt.
Have feedback on this article? Concerned about the content? Get in touch with us directly. Alternatively, email editorial-team (at) simplywallst.com.
This article by Simply Wall St is general in nature. We provide commentary based on historical data and analyst forecasts only using an unbiased methodology and our articles are not intended to be financial advice. It does not constitute a recommendation to buy or sell any stock, and does not take account of your objectives, or your financial situation. We aim to bring you long-term focused analysis driven by fundamental data. Note that our analysis may not factor in the latest price-sensitive company announcements or qualitative material. Simply Wall St has no position in any stocks mentioned.
Have feedback on this article? Concerned about the content? Get in touch with us directly. Alternatively, email editorial-team@simplywallst.com
