
 Yahoo Finance
 Paul Hartmann AG's (FRA:PHH2) Share Price Could Signal Some Risk
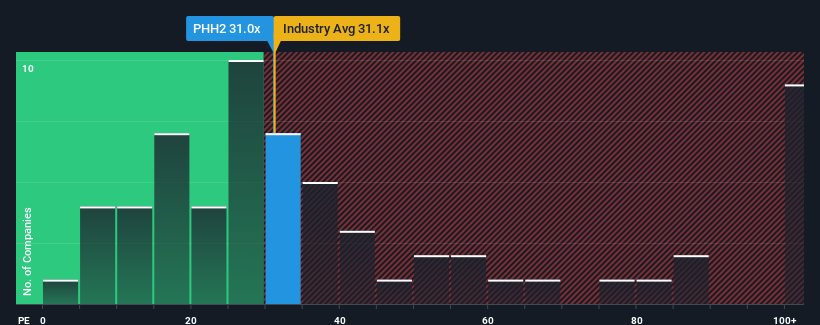
Paul Hartmann AG's (FRA:PHH2) price-to-earnings (or "P/E") ratio of 31x might make it look like a strong sell right now compared to the market in Germany, where around half of the companies have P/E ratios below 16x and even P/E's below 9x are quite common. Nonetheless, we'd need to dig a little deeper to determine if there is a rational basis for the highly elevated P/E.
As an illustration, earnings have deteriorated at Paul Hartmann over the last year, which is not ideal at all. One possibility is that the P/E is high because investors think the company will still do enough to outperform the broader market in the near future. You'd really hope so, otherwise you're paying a pretty hefty price for no particular reason.
View our latest analysis for Paul Hartmann
Want the full picture on earnings, revenue and cash flow for the company? Then our free report on Paul Hartmann will help you shine a light on its historical performance.
Is There Enough Growth For Paul Hartmann?
Paul Hartmann's P/E ratio would be typical for a company that's expected to deliver very strong growth, and importantly, perform much better than the market.
Retrospectively, the last year delivered a frustrating 58% decrease to the company's bottom line. This means it has also seen a slide in earnings over the longer-term as EPS is down 75% in total over the last three years. Accordingly, shareholders would have felt downbeat about the medium-term rates of earnings growth.
In contrast to the company, the rest of the market is expected to grow by 9.8% over the next year, which really puts the company's recent medium-term earnings decline into perspective.
In light of this, it's alarming that Paul Hartmann's P/E sits above the majority of other companies. Apparently many investors in the company are way more bullish than recent times would indicate and aren't willing to let go of their stock at any price. There's a very good chance existing shareholders are setting themselves up for future disappointment if the P/E falls to levels more in line with the recent negative growth rates.
The Bottom Line On Paul Hartmann's P/E
Typically, we'd caution against reading too much into price-to-earnings ratios when settling on investment decisions, though it can reveal plenty about what other market participants think about the company.
Our examination of Paul Hartmann revealed its shrinking earnings over the medium-term aren't impacting its high P/E anywhere near as much as we would have predicted, given the market is set to grow. When we see earnings heading backwards and underperforming the market forecasts, we suspect the share price is at risk of declining, sending the high P/E lower. Unless the recent medium-term conditions improve markedly, it's very challenging to accept these prices as being reasonable.
And what about other risks? Every company has them, and we've spotted 3 warning signs for Paul Hartmann (of which 2 are significant!) you should know about.
You might be able to find a better investment than Paul Hartmann. If you want a selection of possible candidates, check out this free list of interesting companies that trade on a low P/E (but have proven they can grow earnings).
Have feedback on this article? Concerned about the content? Get in touch with us directly. Alternatively, email editorial-team (at) simplywallst.com.
This article by Simply Wall St is general in nature. We provide commentary based on historical data and analyst forecasts only using an unbiased methodology and our articles are not intended to be financial advice. It does not constitute a recommendation to buy or sell any stock, and does not take account of your objectives, or your financial situation. We aim to bring you long-term focused analysis driven by fundamental data. Note that our analysis may not factor in the latest price-sensitive company announcements or qualitative material. Simply Wall St has no position in any stocks mentioned.
