
 Yahoo Finance
 The past three years for Serko (NZSE:SKO) investors has not been profitable
If you are building a properly diversified stock portfolio, the chances are some of your picks will perform badly. But the long term shareholders of Serko Limited (NZSE:SKO) have had an unfortunate run in the last three years. Sadly for them, the share price is down 57% in that time. Shareholders have had an even rougher run lately, with the share price down 17% in the last 90 days.
Since shareholders are down over the longer term, lets look at the underlying fundamentals over the that time and see if they've been consistent with returns.
See our latest analysis for Serko
Serko wasn't profitable in the last twelve months, it is unlikely we'll see a strong correlation between its share price and its earnings per share (EPS). Arguably revenue is our next best option. When a company doesn't make profits, we'd generally hope to see good revenue growth. That's because it's hard to be confident a company will be sustainable if revenue growth is negligible, and it never makes a profit.
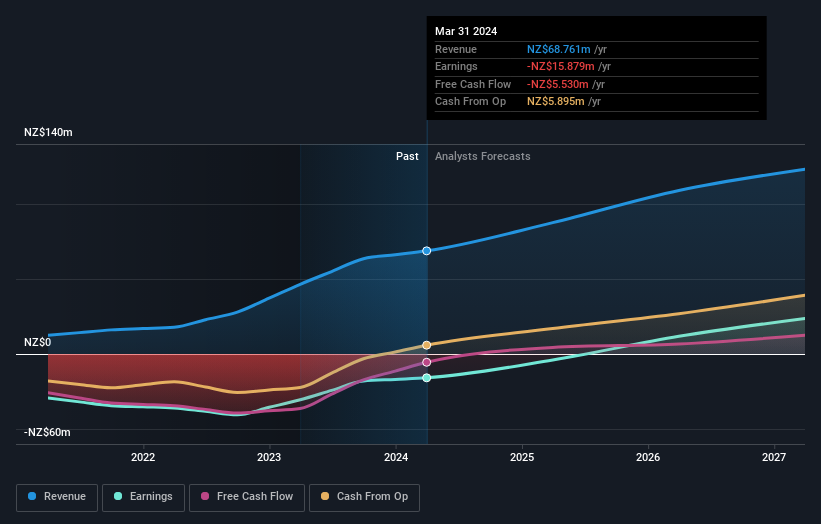
Over three years, Serko grew revenue at 60% per year. That is faster than most pre-profit companies. The share price has moved in quite the opposite direction, down 16% over that time, a bad result. This could mean hype has come out of the stock because the losses are concerning investors. But a share price drop of that magnitude could well signal that the market is overly negative on the stock.
The company's revenue and earnings (over time) are depicted in the image below (click to see the exact numbers).
If you are thinking of buying or selling Serko stock, you should check out this FREE detailed report on its balance sheet.
A Different Perspective
We regret to report that Serko shareholders are down 10.0% for the year. Unfortunately, that's worse than the broader market decline of 0.02%. However, it could simply be that the share price has been impacted by broader market jitters. It might be worth keeping an eye on the fundamentals, in case there's a good opportunity. Unfortunately, last year's performance may indicate unresolved challenges, given that it was worse than the annualised loss of 5% over the last half decade. Generally speaking long term share price weakness can be a bad sign, though contrarian investors might want to research the stock in hope of a turnaround. It's always interesting to track share price performance over the longer term. But to understand Serko better, we need to consider many other factors. For example, we've discovered 1 warning sign for Serko that you should be aware of before investing here.
If you like to buy stocks alongside management, then you might just love this free list of companies. (Hint: many of them are unnoticed AND have attractive valuation).
Please note, the market returns quoted in this article reflect the market weighted average returns of stocks that currently trade on New Zealander exchanges.
Have feedback on this article? Concerned about the content? Get in touch with us directly. Alternatively, email editorial-team (at) simplywallst.com.
This article by Simply Wall St is general in nature. We provide commentary based on historical data and analyst forecasts only using an unbiased methodology and our articles are not intended to be financial advice. It does not constitute a recommendation to buy or sell any stock, and does not take account of your objectives, or your financial situation. We aim to bring you long-term focused analysis driven by fundamental data. Note that our analysis may not factor in the latest price-sensitive company announcements or qualitative material. Simply Wall St has no position in any stocks mentioned.
Have feedback on this article? Concerned about the content? Get in touch with us directly. Alternatively, email editorial-team@simplywallst.com
