
 Yahoo Finance
 P.I.E. Industrial Berhad's (KLSE:PIE) Returns On Capital Are Heading Higher
Did you know there are some financial metrics that can provide clues of a potential multi-bagger? Ideally, a business will show two trends; firstly a growing return on capital employed (ROCE) and secondly, an increasing amount of capital employed. Put simply, these types of businesses are compounding machines, meaning they are continually reinvesting their earnings at ever-higher rates of return. So on that note, P.I.E. Industrial Berhad (KLSE:PIE) looks quite promising in regards to its trends of return on capital.
What Is Return On Capital Employed (ROCE)?
For those that aren't sure what ROCE is, it measures the amount of pre-tax profits a company can generate from the capital employed in its business. The formula for this calculation on P.I.E. Industrial Berhad is:
Return on Capital Employed = Earnings Before Interest and Tax (EBIT) ÷ (Total Assets - Current Liabilities)
0.13 = RM83m ÷ (RM898m - RM243m) (Based on the trailing twelve months to March 2024).
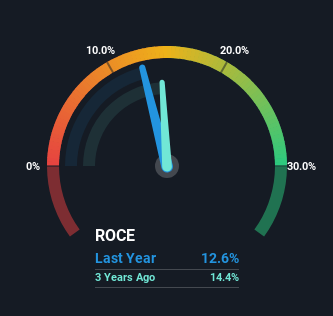
So, P.I.E. Industrial Berhad has an ROCE of 13%. In absolute terms, that's a satisfactory return, but compared to the Electrical industry average of 10% it's much better.
See our latest analysis for P.I.E. Industrial Berhad
In the above chart we have measured P.I.E. Industrial Berhad's prior ROCE against its prior performance, but the future is arguably more important. If you'd like to see what analysts are forecasting going forward, you should check out our free analyst report for P.I.E. Industrial Berhad .
So How Is P.I.E. Industrial Berhad's ROCE Trending?
P.I.E. Industrial Berhad is displaying some positive trends. The numbers show that in the last five years, the returns generated on capital employed have grown considerably to 13%. Basically the business is earning more per dollar of capital invested and in addition to that, 50% more capital is being employed now too. The increasing returns on a growing amount of capital is common amongst multi-baggers and that's why we're impressed.
The Key Takeaway
A company that is growing its returns on capital and can consistently reinvest in itself is a highly sought after trait, and that's what P.I.E. Industrial Berhad has. Since the stock has returned a staggering 407% to shareholders over the last five years, it looks like investors are recognizing these changes. Therefore, we think it would be worth your time to check if these trends are going to continue.
On a separate note, we've found 1 warning sign for P.I.E. Industrial Berhad you'll probably want to know about.
If you want to search for solid companies with great earnings, check out this free list of companies with good balance sheets and impressive returns on equity.
Have feedback on this article? Concerned about the content? Get in touch with us directly. Alternatively, email editorial-team (at) simplywallst.com.
This article by Simply Wall St is general in nature. We provide commentary based on historical data and analyst forecasts only using an unbiased methodology and our articles are not intended to be financial advice. It does not constitute a recommendation to buy or sell any stock, and does not take account of your objectives, or your financial situation. We aim to bring you long-term focused analysis driven by fundamental data. Note that our analysis may not factor in the latest price-sensitive company announcements or qualitative material. Simply Wall St has no position in any stocks mentioned.
Have feedback on this article? Concerned about the content? Get in touch with us directly. Alternatively, email editorial-team@simplywallst.com
