
 Yahoo Finance
 Oxford Metrics (LON:OMG) Could Be Struggling To Allocate Capital
If we want to find a potential multi-bagger, often there are underlying trends that can provide clues. Ideally, a business will show two trends; firstly a growing return on capital employed (ROCE) and secondly, an increasing amount of capital employed. This shows us that it's a compounding machine, able to continually reinvest its earnings back into the business and generate higher returns. In light of that, when we looked at Oxford Metrics (LON:OMG) and its ROCE trend, we weren't exactly thrilled.
Understanding Return On Capital Employed (ROCE)
Just to clarify if you're unsure, ROCE is a metric for evaluating how much pre-tax income (in percentage terms) a company earns on the capital invested in its business. Analysts use this formula to calculate it for Oxford Metrics:
Return on Capital Employed = Earnings Before Interest and Tax (EBIT) ÷ (Total Assets - Current Liabilities)
0.043 = UK£3.7m ÷ (UK£97m - UK£11m) (Based on the trailing twelve months to March 2024).
Therefore, Oxford Metrics has an ROCE of 4.3%. Ultimately, that's a low return and it under-performs the Software industry average of 9.8%.
View our latest analysis for Oxford Metrics
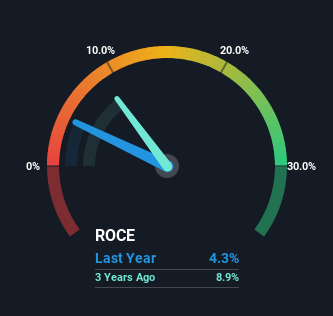
Above you can see how the current ROCE for Oxford Metrics compares to its prior returns on capital, but there's only so much you can tell from the past. If you'd like to see what analysts are forecasting going forward, you should check out our free analyst report for Oxford Metrics .
What The Trend Of ROCE Can Tell Us
In terms of Oxford Metrics' historical ROCE movements, the trend isn't fantastic. To be more specific, ROCE has fallen from 15% over the last five years. However, given capital employed and revenue have both increased it appears that the business is currently pursuing growth, at the consequence of short term returns. And if the increased capital generates additional returns, the business, and thus shareholders, will benefit in the long run.
On a related note, Oxford Metrics has decreased its current liabilities to 11% of total assets. That could partly explain why the ROCE has dropped. Effectively this means their suppliers or short-term creditors are funding less of the business, which reduces some elements of risk. Some would claim this reduces the business' efficiency at generating ROCE since it is now funding more of the operations with its own money.
Our Take On Oxford Metrics' ROCE
While returns have fallen for Oxford Metrics in recent times, we're encouraged to see that sales are growing and that the business is reinvesting in its operations. These trends are starting to be recognized by investors since the stock has delivered a 18% gain to shareholders who've held over the last five years. Therefore we'd recommend looking further into this stock to confirm if it has the makings of a good investment.
If you'd like to know more about Oxford Metrics, we've spotted 3 warning signs, and 1 of them is a bit concerning.
For those who like to invest in solid companies, check out this free list of companies with solid balance sheets and high returns on equity.
Have feedback on this article? Concerned about the content? Get in touch with us directly. Alternatively, email editorial-team (at) simplywallst.com.
This article by Simply Wall St is general in nature. We provide commentary based on historical data and analyst forecasts only using an unbiased methodology and our articles are not intended to be financial advice. It does not constitute a recommendation to buy or sell any stock, and does not take account of your objectives, or your financial situation. We aim to bring you long-term focused analysis driven by fundamental data. Note that our analysis may not factor in the latest price-sensitive company announcements or qualitative material. Simply Wall St has no position in any stocks mentioned.
Have feedback on this article? Concerned about the content? Get in touch with us directly. Alternatively, email editorial-team@simplywallst.com
