
 Yahoo Finance
 Origin Materials, Inc. (NASDAQ:ORGN) most popular amongst retail investors who own 56% of the shares, institutions hold 23%
Key Insights
The considerable ownership by retail investors in Origin Materials indicates that they collectively have a greater say in management and business strategy
Top 25 investors have a 39% stake in the company
To get a sense of who is truly in control of Origin Materials, Inc. ( NASDAQ:ORGN ), it is important to understand the ownership structure of the business. With 56% stake, retail investors possess the maximum shares in the company. In other words, the group stands to gain the most (or lose the most) from their investment into the company.
Institutions, on the other hand, account for 23% of the company's stockholders. Insiders often own a large chunk of younger, smaller, companies while huge companies tend to have institutions as shareholders.
Let's delve deeper into each type of owner of Origin Materials, beginning with the chart below.
Check out our latest analysis for Origin Materials

What Does The Institutional Ownership Tell Us About Origin Materials?
Institutional investors commonly compare their own returns to the returns of a commonly followed index. So they generally do consider buying larger companies that are included in the relevant benchmark index.
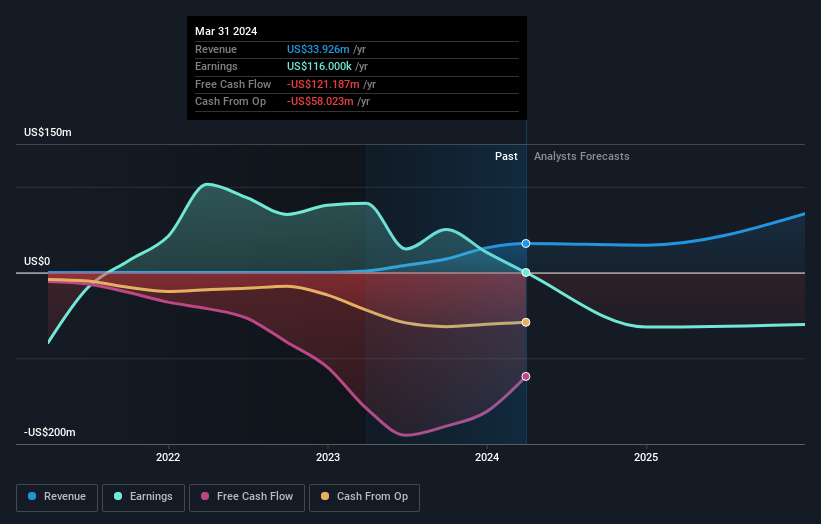
Origin Materials already has institutions on the share registry. Indeed, they own a respectable stake in the company. This implies the analysts working for those institutions have looked at the stock and they like it. But just like anyone else, they could be wrong. It is not uncommon to see a big share price drop if two large institutional investors try to sell out of a stock at the same time. So it is worth checking the past earnings trajectory of Origin Materials, (below). Of course, keep in mind that there are other factors to consider, too.
Hedge funds don't have many shares in Origin Materials. The company's largest shareholder is Evergreen Capital, L.P., with ownership of 6.7%. With 5.6% and 4.0% of the shares outstanding respectively, BlackRock, Inc. and The Vanguard Group, Inc. are the second and third largest shareholders. In addition, we found that John Bissell, the CEO has 0.6% of the shares allocated to their name.
Our studies suggest that the top 25 shareholders collectively control less than half of the company's shares, meaning that the company's shares are widely disseminated and there is no dominant shareholder.
While it makes sense to study institutional ownership data for a company, it also makes sense to study analyst sentiments to know which way the wind is blowing. While there is some analyst coverage, the company is probably not widely covered. So it could gain more attention, down the track.
Insider Ownership Of Origin Materials
The definition of company insiders can be subjective and does vary between jurisdictions. Our data reflects individual insiders, capturing board members at the very least. Company management run the business, but the CEO will answer to the board, even if he or she is a member of it.
Most consider insider ownership a positive because it can indicate the board is well aligned with other shareholders. However, on some occasions too much power is concentrated within this group.
We can report that insiders do own shares in Origin Materials, Inc.. It has a market capitalization of just US$153m, and insiders have US$12m worth of shares, in their own names. It is good to see some investment by insiders, but we usually like to see higher insider holdings. It might be worth checking if those insiders have been buying.
General Public Ownership
The general public, who are usually individual investors, hold a substantial 56% stake in Origin Materials, suggesting it is a fairly popular stock. This level of ownership gives investors from the wider public some power to sway key policy decisions such as board composition, executive compensation, and the dividend payout ratio.
Private Equity Ownership
Private equity firms hold a 6.7% stake in Origin Materials. This suggests they can be influential in key policy decisions. Some might like this, because private equity are sometimes activists who hold management accountable. But other times, private equity is selling out, having taking the company public.
Private Company Ownership
Our data indicates that Private Companies hold 6.5%, of the company's shares. Private companies may be related parties. Sometimes insiders have an interest in a public company through a holding in a private company, rather than in their own capacity as an individual. While it's hard to draw any broad stroke conclusions, it is worth noting as an area for further research.
Next Steps:
While it is well worth considering the different groups that own a company, there are other factors that are even more important. For example, we've discovered 5 warning signs for Origin Materials (3 are concerning!) that you should be aware of before investing here.
If you would prefer discover what analysts are predicting in terms of future growth, do not miss this free report on analyst forecasts .
NB: Figures in this article are calculated using data from the last twelve months, which refer to the 12-month period ending on the last date of the month the financial statement is dated. This may not be consistent with full year annual report figures.
Have feedback on this article? Concerned about the content? Get in touch with us directly. Alternatively, email editorial-team (at) simplywallst.com.
This article by Simply Wall St is general in nature. We provide commentary based on historical data and analyst forecasts only using an unbiased methodology and our articles are not intended to be financial advice. It does not constitute a recommendation to buy or sell any stock, and does not take account of your objectives, or your financial situation. We aim to bring you long-term focused analysis driven by fundamental data. Note that our analysis may not factor in the latest price-sensitive company announcements or qualitative material. Simply Wall St has no position in any stocks mentioned.
