
 Yahoo Finance
 Old Chang Kee (Catalist:5ML) Has More To Do To Multiply In Value Going Forward
There are a few key trends to look for if we want to identify the next multi-bagger. In a perfect world, we'd like to see a company investing more capital into its business and ideally the returns earned from that capital are also increasing. Put simply, these types of businesses are compounding machines, meaning they are continually reinvesting their earnings at ever-higher rates of return. So, when we ran our eye over Old Chang Kee's (Catalist:5ML) trend of ROCE, we liked what we saw.
Return On Capital Employed (ROCE): What Is It?
Just to clarify if you're unsure, ROCE is a metric for evaluating how much pre-tax income (in percentage terms) a company earns on the capital invested in its business. Analysts use this formula to calculate it for Old Chang Kee:
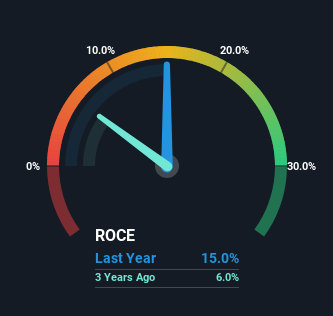
Return on Capital Employed = Earnings Before Interest and Tax (EBIT) ÷ (Total Assets - Current Liabilities)
0.15 = S$8.7m ÷ (S$83m - S$25m) (Based on the trailing twelve months to September 2023).
Therefore, Old Chang Kee has an ROCE of 15%. In absolute terms, that's a satisfactory return, but compared to the Food industry average of 7.6% it's much better.
View our latest analysis for Old Chang Kee
While the past is not representative of the future, it can be helpful to know how a company has performed historically, which is why we have this chart above. If you want to delve into the historical earnings , check out these free graphs detailing revenue and cash flow performance of Old Chang Kee.
How Are Returns Trending?
While the returns on capital are good, they haven't moved much. The company has consistently earned 15% for the last five years, and the capital employed within the business has risen 51% in that time. Since 15% is a moderate ROCE though, it's good to see a business can continue to reinvest at these decent rates of return. Stable returns in this ballpark can be unexciting, but if they can be maintained over the long run, they often provide nice rewards to shareholders.
What We Can Learn From Old Chang Kee's ROCE
In the end, Old Chang Kee has proven its ability to adequately reinvest capital at good rates of return. In light of this, the stock has only gained 10% over the last five years for shareholders who have owned the stock in this period. So because of the trends we're seeing, we'd recommend looking further into this stock to see if it has the makings of a multi-bagger.
If you want to continue researching Old Chang Kee, you might be interested to know about the 1 warning sign that our analysis has discovered.
While Old Chang Kee may not currently earn the highest returns, we've compiled a list of companies that currently earn more than 25% return on equity. Check out this free list here.
Have feedback on this article? Concerned about the content? Get in touch with us directly. Alternatively, email editorial-team (at) simplywallst.com.
This article by Simply Wall St is general in nature. We provide commentary based on historical data and analyst forecasts only using an unbiased methodology and our articles are not intended to be financial advice. It does not constitute a recommendation to buy or sell any stock, and does not take account of your objectives, or your financial situation. We aim to bring you long-term focused analysis driven by fundamental data. Note that our analysis may not factor in the latest price-sensitive company announcements or qualitative material. Simply Wall St has no position in any stocks mentioned.
