
 Yahoo Finance
 O-I Glass (NYSE:OI) Might Have The Makings Of A Multi-Bagger
If you're looking for a multi-bagger, there's a few things to keep an eye out for. Firstly, we'd want to identify a growing return on capital employed (ROCE) and then alongside that, an ever-increasing base of capital employed. If you see this, it typically means it's a company with a great business model and plenty of profitable reinvestment opportunities. So when we looked at O-I Glass (NYSE:OI) and its trend of ROCE, we really liked what we saw.
What Is Return On Capital Employed (ROCE)?
For those that aren't sure what ROCE is, it measures the amount of pre-tax profits a company can generate from the capital employed in its business. To calculate this metric for O-I Glass, this is the formula:
Return on Capital Employed = Earnings Before Interest and Tax (EBIT) ÷ (Total Assets - Current Liabilities)
0.11 = US$854m ÷ (US$9.7b - US$2.1b) (Based on the trailing twelve months to September 2023).
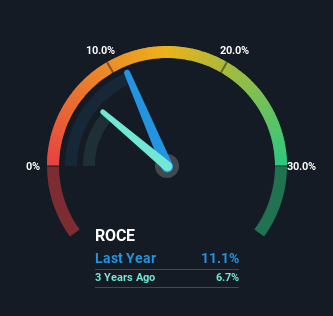
So, O-I Glass has an ROCE of 11%. That's a pretty standard return and it's in line with the industry average of 11%.
View our latest analysis for O-I Glass
Above you can see how the current ROCE for O-I Glass compares to its prior returns on capital, but there's only so much you can tell from the past. If you'd like to see what analysts are forecasting going forward, you should check out our free report for O-I Glass.
So How Is O-I Glass' ROCE Trending?
O-I Glass has not disappointed with their ROCE growth. More specifically, while the company has kept capital employed relatively flat over the last five years, the ROCE has climbed 61% in that same time. So our take on this is that the business has increased efficiencies to generate these higher returns, all the while not needing to make any additional investments. The company is doing well in that sense, and it's worth investigating what the management team has planned for long term growth prospects.
What We Can Learn From O-I Glass' ROCE
To bring it all together, O-I Glass has done well to increase the returns it's generating from its capital employed. Since the total return from the stock has been almost flat over the last five years, there might be an opportunity here if the valuation looks good. That being the case, research into the company's current valuation metrics and future prospects seems fitting.
O-I Glass does come with some risks though, we found 3 warning signs in our investment analysis, and 1 of those is concerning...
For those who like to invest in solid companies, check out this free list of companies with solid balance sheets and high returns on equity.
Have feedback on this article? Concerned about the content? Get in touch with us directly. Alternatively, email editorial-team (at) simplywallst.com.
This article by Simply Wall St is general in nature. We provide commentary based on historical data and analyst forecasts only using an unbiased methodology and our articles are not intended to be financial advice. It does not constitute a recommendation to buy or sell any stock, and does not take account of your objectives, or your financial situation. We aim to bring you long-term focused analysis driven by fundamental data. Note that our analysis may not factor in the latest price-sensitive company announcements or qualitative material. Simply Wall St has no position in any stocks mentioned.
