
 Yahoo Finance
 A Note On SU Group Holdings Limited's (NASDAQ:SUGP) ROE and Debt To Equity
One of the best investments we can make is in our own knowledge and skill set. With that in mind, this article will work through how we can use Return On Equity (ROE) to better understand a business. To keep the lesson grounded in practicality, we'll use ROE to better understand SU Group Holdings Limited (NASDAQ:SUGP).
Return on equity or ROE is a key measure used to assess how efficiently a company's management is utilizing the company's capital. Put another way, it reveals the company's success at turning shareholder investments into profits.
View our latest analysis for SU Group Holdings
How To Calculate Return On Equity?
The formula for ROE is:
Return on Equity = Net Profit (from continuing operations) ÷ Shareholders' Equity
So, based on the above formula, the ROE for SU Group Holdings is:
11% = HK$9.8m ÷ HK$91m (Based on the trailing twelve months to March 2024).
The 'return' is the income the business earned over the last year. One way to conceptualize this is that for each $1 of shareholders' capital it has, the company made $0.11 in profit.
Does SU Group Holdings Have A Good ROE?
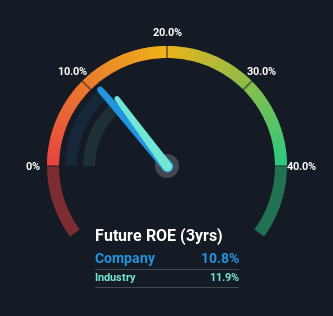
By comparing a company's ROE with its industry average, we can get a quick measure of how good it is. The limitation of this approach is that some companies are quite different from others, even within the same industry classification. If you look at the image below, you can see SU Group Holdings has a similar ROE to the average in the Commercial Services industry classification (12%).
That's neither particularly good, nor bad. While at least the ROE is not lower than the industry, its still worth checking what role the company's debt plays as high debt levels relative to equity may also make the ROE appear high. If a company takes on too much debt, it is at higher risk of defaulting on interest payments. To know the 4 risks we have identified for SU Group Holdings visit our risks dashboard for free.
Why You Should Consider Debt When Looking At ROE
Companies usually need to invest money to grow their profits. The cash for investment can come from prior year profits (retained earnings), issuing new shares, or borrowing. In the first and second cases, the ROE will reflect this use of cash for investment in the business. In the latter case, the debt used for growth will improve returns, but won't affect the total equity. That will make the ROE look better than if no debt was used.
SU Group Holdings' Debt And Its 11% ROE
Shareholders will be pleased to learn that SU Group Holdings has not one iota of net debt! Its ROE suggests it is a decent business; and the fact it is not leveraging returns indicates it is well worth watching. After all, when a company has a strong balance sheet, it can often find ways to invest in growth, even if it takes some time.
Conclusion
Return on equity is useful for comparing the quality of different businesses. A company that can achieve a high return on equity without debt could be considered a high quality business. All else being equal, a higher ROE is better.
But ROE is just one piece of a bigger puzzle, since high quality businesses often trade on high multiples of earnings. It is important to consider other factors, such as future profit growth -- and how much investment is required going forward. Check the past profit growth by SU Group Holdings by looking at this visualization of past earnings, revenue and cash flow.
If you would prefer check out another company -- one with potentially superior financials -- then do not miss this free list of interesting companies, that have HIGH return on equity and low debt.
Have feedback on this article? Concerned about the content? Get in touch with us directly. Alternatively, email editorial-team (at) simplywallst.com.
This article by Simply Wall St is general in nature. We provide commentary based on historical data and analyst forecasts only using an unbiased methodology and our articles are not intended to be financial advice. It does not constitute a recommendation to buy or sell any stock, and does not take account of your objectives, or your financial situation. We aim to bring you long-term focused analysis driven by fundamental data. Note that our analysis may not factor in the latest price-sensitive company announcements or qualitative material. Simply Wall St has no position in any stocks mentioned.
Have feedback on this article? Concerned about the content? Get in touch with us directly. Alternatively, email editorial-team@simplywallst.com
