
 Yahoo Finance
 NIKE (NKE) Q4 Earnings Surpass Estimates, Revenues Down Y/Y
NIKE Inc. NKE reported fourth-quarter fiscal 2024 results, wherein the bottom line beat the Zacks Consensus Estimate while the top line missed the same. Moreover, revenues fell year over year. The company’s earnings per share (EPS) were $1.01, up from 66 cents in the year-ago quarter. Also, the figure beat the consensus estimate of earnings of 85 cents per share.
Revenues of the Swoosh brand owner dipped 2% year over year to $12.6 billion and missed the Zacks Consensus Estimate of $12.9 billion. On a currency-neutral basis, revenues were flat year over year.
Sales at NIKE Direct were down 8% on a reported basis and 7% on a currency-neutral basis to $5.1 billion. This included a 10% drop at NIKE Digital and 2% at NIKE-owned stores. Also, wholesale revenues were $7.1 billion, up 5% year over year on a reported basis and 8% on a currency-neutral basis.
Overall, shares of this Zacks Rank #3 (Hold) company have gained 3.2% in the past month compared with the industry’s 2.9% growth.
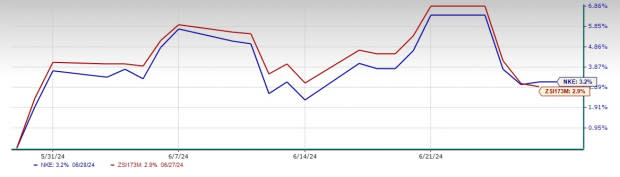
Image Source: Zacks Investment Research
Operating Segments
The NIKE Brand revenues were $12.1 billion, down 1% year over year on a reported basis but up 1% on a currency-neutral basis. Results were driven by currency-neutral growth in Greater China, EMEA and APLA, partially negated by declines in North America.
We estimated total NIKE Brand revenues to rise 0.9% year over year to $12.3 billion, driven by a 3.1% drop in Direct-to-Consumer and a 4.3% rise in the Wholesale business.
Within the NIKE brand, revenues in North America fell 1% year over year to $5.3 billion. Sales for the NIKE Direct business were down 9% in the region, including an 11% decrease at Nike Digital and a 5% fall at Nike Stores. Wholesale sales grew 6%.
In EMEA, the company’s revenues inched up 1% to $3.3 billion. The Wholesale business revenues rose 7% year over year. NIKE Direct revenues for the segment dipped 8%, with 1% growth in Nike Stores and a 14% decrease at Nike Digital.
In Greater China, revenues advanced 7% year over year in the fiscal fourth quarter to $1.9 billion. NIKE Direct fell 2%, while NIKE Digital revenues were up 8% year over year and Nike stores were down 6%. Moreover, Wholesale revenues grew 15%.
In APLA, revenues rose 4% year over year to $1.7 billion. NIKE Direct dipped 3%, driven by an 11% hike in NIKE stores and a 12% drop in Nike Digital.
Revenues at the Converse brand dropped 18% on a reported basis and 17% on a currency-neutral basis to $480 million. The decline was led by softness in North America and Western Europe.
Costs & Margins
The gross profit rose 1% year over year to $5.6 billion while the gross margin expanded 110 basis points (bps) to 44.7%. We anticipated the gross margin to expand 150 bps to 45.1%. The gross margin expansion can be attributed to the company’s effective pricing actions and reduced ocean freight rates and logistics costs, partly negated by weak margins in NIKE Direct and adverse foreign currency impacts.
Selling and administrative expenses fell 7% to $4.1 billion compared with our estimate of a 1% drop to $4.3 billion. Demand-Creation expenses were flat year over year at $1.1 billion, owing to lower sports marketing expenses, which were offset by increased advertising and marketing expenses. Operating overhead expenses were down 9% year over year to $3 billion on reduced wage-related expenses and restructuring charges.
Our model predicted Demand-Creation expenses of $1.1 billion, indicating a year-over-year rise of 0.4%. Operating overhead expenses were anticipated to fall 1.4% year over year to $3.2 billion.
Balance Sheet & Shareholder-Friendly Moves
The company ended the quarter with cash and cash equivalents of $9.9 billion, up nearly 33% year over year. Short-term investments were $1.7 billion, down 47% year over year. It had a long-term debt (excluding current maturities) of $7.9 billion and shareholders’ equity of $14.4 billion as of May 31, 2024.
As of the same date, inventories of $7.5 billion were down 11% from the prior-year levels.
In the fiscal fourth quarter, the company returned $1.6 billion to shareholders, including $1 billion in share repurchases and $560 million in dividends. With the share repurchases, it retired 41.4 million shares as part of the four-year, $18-billion share repurchase program approved by the company in June 2022. As of May 31, NIKE repurchased 84.9 million shares under the program for $9.1 billion.
Outlook
The company has been witnessing a highly promotional landscape across the China marketplace. Management cited that the outlook for the near term has softened. However, it is confident of NIKE's competitive position in China over the long term. Management expects lower NIKE Digital growth, mainly in the first half of fiscal 2025. This is due to weak traffic on fewer launches, planned decreases in classic footwear franchises, reduced promotional activity and elevated macro uncertainty, mainly in greater China, with uneven consumer trends continuing in EMEA and other markets across the globe.
Consequently, the company now projects fiscal 2025 reported revenues to decline mid-single digits, with revenues in the first half down in high-single digits. It expects foreign exchange headwinds to worsen, with a one-point translational impact on revenues.
The gross margin is likely to expand in the 10-30 bps range on a reported basis on benefits from strategic pricing actions and reduced product input costs, partly offset by a deleveraged supply chain, channel mix shifts and net foreign exchange impact. SG&A is anticipated to grow slightly year over year on higher investments in demand creation to ignite brand momentum while operating overhead is likely to remain flat. Other income and expenses, including net interest income, are forecast in the range of $250-$300 million for the fiscal year. The company expects an effective tax rate in the high teens range.
For the first quarter of fiscal 2025, NIKE estimates revenues to decline approximately 10% due to more aggressive actions in managing its classic footwear franchises, persistent challenges on NIKE Digital, muted wholesale order books, a weaker outlook in greater China and numerous quarter-specific timing factors. It predicts fiscal first-quarter gross margins to remain in line with the fiscal 2025 view, and SG&A at mid-single digits and flat operating overheads.
Key Picks
Some better-ranked companies are G-III Apparel Group GIII, Royal Caribbean RCL and lululemon athletica LULU.
G-III Apparel Group sports a Zacks Rank #1 (Strong Buy) at present. You can see the complete list of today’s Zacks #1 Rank stocks here.
G-III Apparel Group has a trailing four-quarter earnings surprise of 571.8%, on average. The Zacks Consensus Estimate for GIII’s fiscal 2024 sales indicates an increase of 3.3% from the year-ago period’s reported level.
Royal Caribbean sports a Zacks Rank of 1, at present. RCL has a trailing four-quarter earnings surprise of 18.3%, on average.
The consensus estimate for RCL’s 2024 sales and EPS indicates increases of 16.9% and 64%, respectively, from the year-ago period’s reported levels.
lululemon athletica is a yoga-inspired athletic apparel company. LULU carries a Zacks Rank #2 (Buy) at present.
The Zacks Consensus Estimate for lululemon athletica’s current financial-year sales and EPS indicates growth of 11.4% and 11.9%, respectively, from the year-ago corresponding figures. LULU has a trailing four-quarter earnings surprise of 7.4%, on average.
Want the latest recommendations from Zacks Investment Research? Today, you can download 7 Best Stocks for the Next 30 Days. Click to get this free report
NIKE, Inc. (NKE): Free Stock Analysis Report
Royal Caribbean Cruises Ltd. (RCL): Free Stock Analysis Report
lululemon athletica inc. (LULU): Free Stock Analysis Report
G-III Apparel Group, LTD. (GIII): Free Stock Analysis Report
