
 Yahoo Finance
 NanoXplore's (TSE:GRA) investors will be pleased with their notable 91% return over the last five years
When we invest, we're generally looking for stocks that outperform the market average. And while active stock picking involves risks (and requires diversification) it can also provide excess returns. For example, the NanoXplore Inc. (TSE:GRA) share price is up 91% in the last 5 years, clearly besting the market return of around 34% (ignoring dividends).
Let's take a look at the underlying fundamentals over the longer term, and see if they've been consistent with shareholders returns.
Check out our latest analysis for NanoXplore
NanoXplore wasn't profitable in the last twelve months, it is unlikely we'll see a strong correlation between its share price and its earnings per share (EPS). Arguably revenue is our next best option. When a company doesn't make profits, we'd generally hope to see good revenue growth. Some companies are willing to postpone profitability to grow revenue faster, but in that case one would hope for good top-line growth to make up for the lack of earnings.
For the last half decade, NanoXplore can boast revenue growth at a rate of 16% per year. Even measured against other revenue-focussed companies, that's a good result. While the compound gain of 14% per year is good, it's not unreasonable given the strong revenue growth. If the strong revenue growth continues, we'd hope to see the share price to follow, in time. Opportunity lies where the market hasn't fully priced growth in the underlying business.
You can see how earnings and revenue have changed over time in the image below (click on the chart to see the exact values).
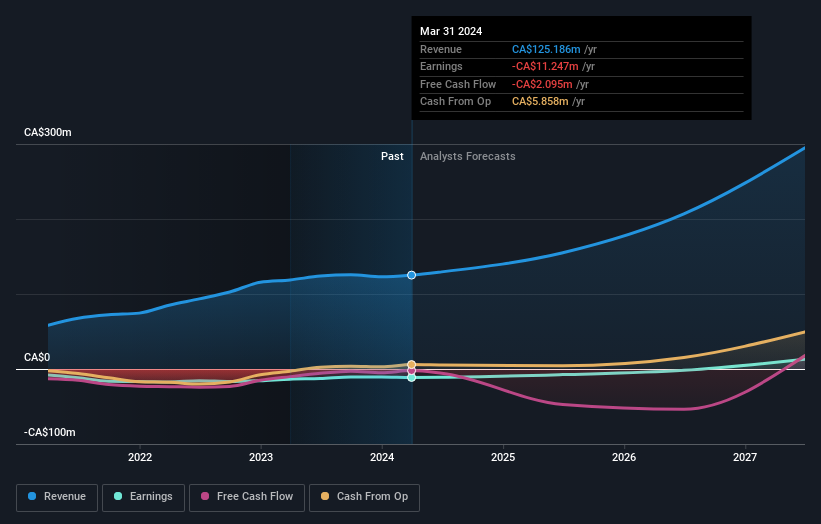
We consider it positive that insiders have made significant purchases in the last year. Even so, future earnings will be far more important to whether current shareholders make money. If you are thinking of buying or selling NanoXplore stock, you should check out this free report showing analyst profit forecasts.
A Different Perspective
NanoXplore shareholders are down 24% for the year, but the market itself is up 12%. Even the share prices of good stocks drop sometimes, but we want to see improvements in the fundamental metrics of a business, before getting too interested. Longer term investors wouldn't be so upset, since they would have made 14%, each year, over five years. It could be that the recent sell-off is an opportunity, so it may be worth checking the fundamental data for signs of a long term growth trend. Investors who like to make money usually check up on insider purchases, such as the price paid, and total amount bought. You can find out about the insider purchases of NanoXplore by clicking this link.
If you like to buy stocks alongside management, then you might just love this free list of companies. (Hint: most of them are flying under the radar).
Please note, the market returns quoted in this article reflect the market weighted average returns of stocks that currently trade on Canadian exchanges.
Have feedback on this article? Concerned about the content? Get in touch with us directly. Alternatively, email editorial-team (at) simplywallst.com.
This article by Simply Wall St is general in nature. We provide commentary based on historical data and analyst forecasts only using an unbiased methodology and our articles are not intended to be financial advice. It does not constitute a recommendation to buy or sell any stock, and does not take account of your objectives, or your financial situation. We aim to bring you long-term focused analysis driven by fundamental data. Note that our analysis may not factor in the latest price-sensitive company announcements or qualitative material. Simply Wall St has no position in any stocks mentioned.
Have feedback on this article? Concerned about the content? Get in touch with us directly. Alternatively, email editorial-team@simplywallst.com
