
 Yahoo Finance
 Is Mr D.I.Y. Group (M) Berhad's (KLSE:MRDIY) Latest Stock Performance A Reflection Of Its Financial Health?
Most readers would already be aware that Mr D.I.Y. Group (M) Berhad's (KLSE:MRDIY) stock increased significantly by 30% over the past three months. Given the company's impressive performance, we decided to study its financial indicators more closely as a company's financial health over the long-term usually dictates market outcomes. Particularly, we will be paying attention to Mr D.I.Y. Group (M) Berhad's ROE today.
Return on equity or ROE is a key measure used to assess how efficiently a company's management is utilizing the company's capital. In short, ROE shows the profit each dollar generates with respect to its shareholder investments.
View our latest analysis for Mr D.I.Y. Group (M) Berhad
How Is ROE Calculated?
The formula for ROE is:
Return on Equity = Net Profit (from continuing operations) ÷ Shareholders' Equity
So, based on the above formula, the ROE for Mr D.I.Y. Group (M) Berhad is:
32% = RM578m ÷ RM1.8b (Based on the trailing twelve months to March 2024).
The 'return' refers to a company's earnings over the last year. Another way to think of that is that for every MYR1 worth of equity, the company was able to earn MYR0.32 in profit.
What Is The Relationship Between ROE And Earnings Growth?
So far, we've learned that ROE is a measure of a company's profitability. We now need to evaluate how much profit the company reinvests or "retains" for future growth which then gives us an idea about the growth potential of the company. Generally speaking, other things being equal, firms with a high return on equity and profit retention, have a higher growth rate than firms that don’t share these attributes.
A Side By Side comparison of Mr D.I.Y. Group (M) Berhad's Earnings Growth And 32% ROE
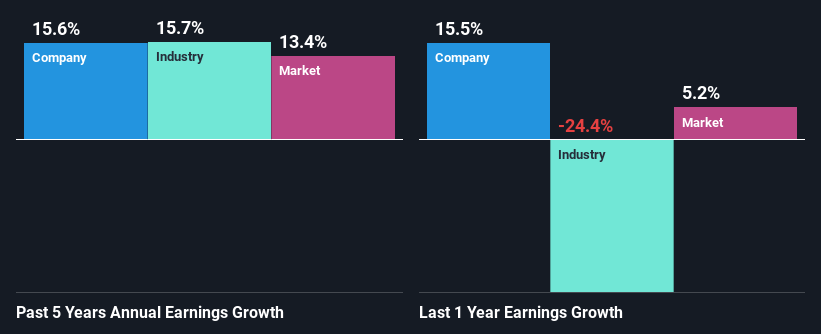
To begin with, Mr D.I.Y. Group (M) Berhad has a pretty high ROE which is interesting. Secondly, even when compared to the industry average of 10% the company's ROE is quite impressive. This probably laid the groundwork for Mr D.I.Y. Group (M) Berhad's moderate 16% net income growth seen over the past five years.
We then performed a comparison between Mr D.I.Y. Group (M) Berhad's net income growth with the industry, which revealed that the company's growth is similar to the average industry growth of 16% in the same 5-year period.
Earnings growth is a huge factor in stock valuation. What investors need to determine next is if the expected earnings growth, or the lack of it, is already built into the share price. This then helps them determine if the stock is placed for a bright or bleak future. One good indicator of expected earnings growth is the P/E ratio which determines the price the market is willing to pay for a stock based on its earnings prospects. So, you may want to check if Mr D.I.Y. Group (M) Berhad is trading on a high P/E or a low P/E, relative to its industry.
Is Mr D.I.Y. Group (M) Berhad Making Efficient Use Of Its Profits?
With a three-year median payout ratio of 44% (implying that the company retains 56% of its profits), it seems that Mr D.I.Y. Group (M) Berhad is reinvesting efficiently in a way that it sees respectable amount growth in its earnings and pays a dividend that's well covered.
Moreover, Mr D.I.Y. Group (M) Berhad is determined to keep sharing its profits with shareholders which we infer from its long history of four years of paying a dividend. Our latest analyst data shows that the future payout ratio of the company is expected to rise to 56% over the next three years. Despite the higher expected payout ratio, the company's ROE is not expected to change by much.
Conclusion
Overall, we are quite pleased with Mr D.I.Y. Group (M) Berhad's performance. In particular, it's great to see that the company is investing heavily into its business and along with a high rate of return, that has resulted in a sizeable growth in its earnings. The latest industry analyst forecasts show that the company is expected to maintain its current growth rate. Are these analysts expectations based on the broad expectations for the industry, or on the company's fundamentals? Click here to be taken to our analyst's forecasts page for the company.
Have feedback on this article? Concerned about the content? Get in touch with us directly. Alternatively, email editorial-team (at) simplywallst.com.
This article by Simply Wall St is general in nature. We provide commentary based on historical data and analyst forecasts only using an unbiased methodology and our articles are not intended to be financial advice. It does not constitute a recommendation to buy or sell any stock, and does not take account of your objectives, or your financial situation. We aim to bring you long-term focused analysis driven by fundamental data. Note that our analysis may not factor in the latest price-sensitive company announcements or qualitative material. Simply Wall St has no position in any stocks mentioned.
Have feedback on this article? Concerned about the content? Get in touch with us directly. Alternatively, email editorial-team@simplywallst.com
