
 Yahoo Finance
 MIND C.T.I (NASDAQ:MNDO) Will Be Hoping To Turn Its Returns On Capital Around
What financial metrics can indicate to us that a company is maturing or even in decline? Businesses in decline often have two underlying trends, firstly, a declining return on capital employed (ROCE) and a declining base of capital employed. Trends like this ultimately mean the business is reducing its investments and also earning less on what it has invested. So after glancing at the trends within MIND C.T.I (NASDAQ:MNDO), we weren't too hopeful.
Return On Capital Employed (ROCE): What Is It?
For those that aren't sure what ROCE is, it measures the amount of pre-tax profits a company can generate from the capital employed in its business. Analysts use this formula to calculate it for MIND C.T.I:
Return on Capital Employed = Earnings Before Interest and Tax (EBIT) ÷ (Total Assets - Current Liabilities)
0.20 = US$4.7m ÷ (US$33m - US$9.2m) (Based on the trailing twelve months to March 2024).
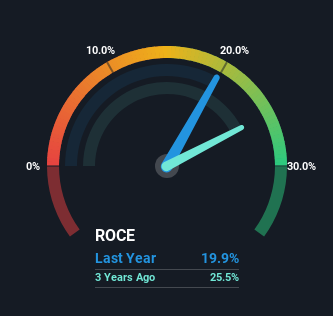
So, MIND C.T.I has an ROCE of 20%. In absolute terms that's a great return and it's even better than the Software industry average of 7.2%.
Check out our latest analysis for MIND C.T.I
While the past is not representative of the future, it can be helpful to know how a company has performed historically, which is why we have this chart above. If you're interested in investigating MIND C.T.I's past further, check out this free graph covering MIND C.T.I's past earnings, revenue and cash flow.
What Does the ROCE Trend For MIND C.T.I Tell Us?
There is reason to be cautious about MIND C.T.I, given the returns are trending downwards. Unfortunately the returns on capital have diminished from the 28% that they were earning five years ago. Meanwhile, capital employed in the business has stayed roughly the flat over the period. This combination can be indicative of a mature business that still has areas to deploy capital, but the returns received aren't as high due potentially to new competition or smaller margins. So because these trends aren't typically conducive to creating a multi-bagger, we wouldn't hold our breath on MIND C.T.I becoming one if things continue as they have.
The Key Takeaway
All in all, the lower returns from the same amount of capital employed aren't exactly signs of a compounding machine. However the stock has delivered a 41% return to shareholders over the last five years, so investors might be expecting the trends to turn around. Regardless, we don't feel too comfortable with the fundamentals so we'd be steering clear of this stock for now.
One final note, you should learn about the 4 warning signs we've spotted with MIND C.T.I (including 3 which don't sit too well with us) .
MIND C.T.I is not the only stock earning high returns. If you'd like to see more, check out our free list of companies earning high returns on equity with solid fundamentals.
Have feedback on this article? Concerned about the content? Get in touch with us directly. Alternatively, email editorial-team (at) simplywallst.com.
This article by Simply Wall St is general in nature. We provide commentary based on historical data and analyst forecasts only using an unbiased methodology and our articles are not intended to be financial advice. It does not constitute a recommendation to buy or sell any stock, and does not take account of your objectives, or your financial situation. We aim to bring you long-term focused analysis driven by fundamental data. Note that our analysis may not factor in the latest price-sensitive company announcements or qualitative material. Simply Wall St has no position in any stocks mentioned.
Have feedback on this article? Concerned about the content? Get in touch with us directly. Alternatively, email editorial-team@simplywallst.com
