
 Yahoo Finance
 Masimo (NASDAQ:MASI) stock falls 6.3% in past week as three-year earnings and shareholder returns continue downward trend
Investing in stocks inevitably means buying into some companies that perform poorly. Long term Masimo Corporation (NASDAQ:MASI) shareholders know that all too well, since the share price is down considerably over three years. Unfortunately, they have held through a 59% decline in the share price in that time. And over the last year the share price fell 27%, so we doubt many shareholders are delighted. Shareholders have had an even rougher run lately, with the share price down 25% in the last 90 days.
With the stock having lost 6.3% in the past week, it's worth taking a look at business performance and seeing if there's any red flags.
See our latest analysis for Masimo
There is no denying that markets are sometimes efficient, but prices do not always reflect underlying business performance. One flawed but reasonable way to assess how sentiment around a company has changed is to compare the earnings per share (EPS) with the share price.
Masimo saw its EPS decline at a compound rate of 29% per year, over the last three years. This change in EPS is reasonably close to the 26% average annual decrease in the share price. So it seems that investor expectations of the company are staying pretty steady, despite the disappointment. In this case, it seems that the EPS is guiding the share price.
The company's earnings per share (over time) is depicted in the image below (click to see the exact numbers).
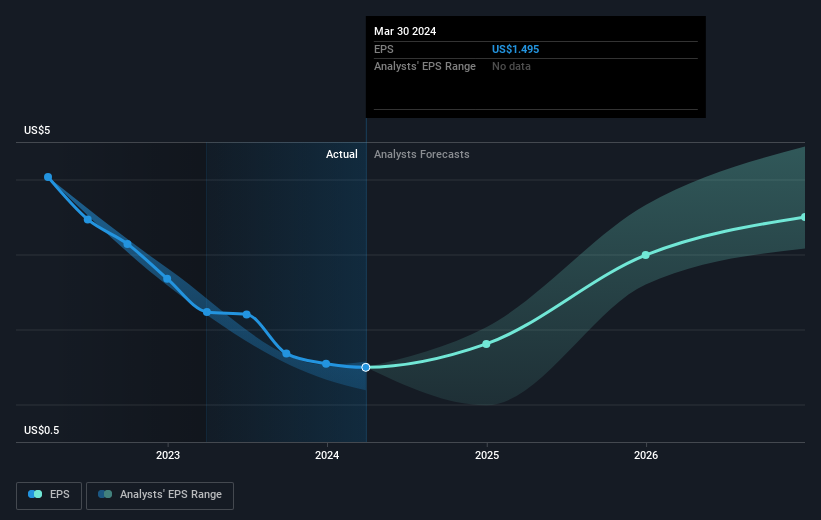
Dive deeper into Masimo's key metrics by checking this interactive graph of Masimo's earnings, revenue and cash flow.
A Different Perspective
While the broader market gained around 25% in the last year, Masimo shareholders lost 27%. Even the share prices of good stocks drop sometimes, but we want to see improvements in the fundamental metrics of a business, before getting too interested. Regrettably, last year's performance caps off a bad run, with the shareholders facing a total loss of 5% per year over five years. We realise that Baron Rothschild has said investors should "buy when there is blood on the streets", but we caution that investors should first be sure they are buying a high quality business. I find it very interesting to look at share price over the long term as a proxy for business performance. But to truly gain insight, we need to consider other information, too. Even so, be aware that Masimo is showing 1 warning sign in our investment analysis , you should know about...
If you like to buy stocks alongside management, then you might just love this free list of companies. (Hint: many of them are unnoticed AND have attractive valuation).
Please note, the market returns quoted in this article reflect the market weighted average returns of stocks that currently trade on American exchanges.
Have feedback on this article? Concerned about the content? Get in touch with us directly. Alternatively, email editorial-team (at) simplywallst.com.
This article by Simply Wall St is general in nature. We provide commentary based on historical data and analyst forecasts only using an unbiased methodology and our articles are not intended to be financial advice. It does not constitute a recommendation to buy or sell any stock, and does not take account of your objectives, or your financial situation. We aim to bring you long-term focused analysis driven by fundamental data. Note that our analysis may not factor in the latest price-sensitive company announcements or qualitative material. Simply Wall St has no position in any stocks mentioned.
Have feedback on this article? Concerned about the content? Get in touch with us directly. Alternatively, email editorial-team@simplywallst.com
