
 Yahoo Finance
 MAS reports lower emissions from its developed market equities, corporate bonds portfolio
But the Weighted Average Carbon Intensity (WACI) of MAS’s emerging market equities portfolio rose slightly y-o-y.
The emissions profile of the Monetary Authority of Singapore’s (MAS) equities and corporate bonds portfolio have largely fallen y-o-y in terms of tonnes of carbon dioxide equivalent (tCO2e) per US$1 million of revenue.
According to MAS’s FY2023/2024 sustainability report, released July 4, the weighted average carbon intensity (WACI) for MAS’s Developed Markets (DM) equities portfolio decreased from FY2022/2023 to FY2023/2024, alongside a decrease in the WACI for the DM equities benchmark, which remained higher than the MAS’s DM equities portfolio.
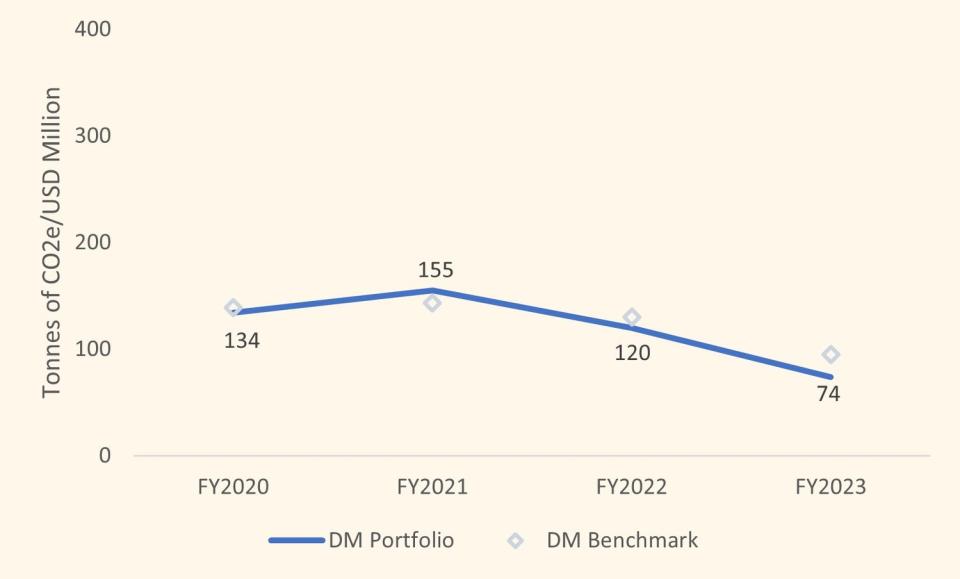
The WACI for MAS’s DM equities portfolio and the benchmark continued to trend lower in the latest financial year, extending a y-o-y decline first seen last financial year.
MAS attributes this to a lower average carbon intensity of companies, especially for the most carbon-intensive sectors like energy, materials and utilities.
As the benchmark only represents a subset of publicly listed companies in the developed markets, the trend observed from the change in WACI levels over time is an “imperfect proxy” of the overall decarbonisation trajectory of the broader economy, says MAS.
“Nonetheless, the downward trend in carbon intensity of the benchmark and the average company across various sectors, especially if sustained, provides a useful reference point on the progress of an orderly low carbon transition in the developed markets,” adds the central bank and regulator in its fourth annual sustainability report.
As of FY2023, the benchmark WACI remained higher than MAS’ DM equities portfolio WACI. “Active investment allocation decisions of our external managers coupled with the effect of targeted portfolio actions, such as the Climate Transition Programme (CTP) and the exclusion of thermal coal mining and oil sand companies, helped to tilt the portfolio towards less carbon-intensive companies relative to the benchmark,” says MAS.
Meanwhile, the WACI for MAS’s Emerging Markets (EM) equities portfolio increased slightly from FY2022/2032 to FY2023/2024, but remained “significantly lower” than the WACI for the EM equities benchmark, which remained almost flat over the period.

The increase in WACI for MAS’s EM equities portfolio was attributed to active investment decisions of external managers, which increased weights to selected companies with higher carbon intensity in the utilities sector.
Nonetheless, WACI of the portfolio remained lower than the benchmark as the portfolio continued to remain underweight to the energy, materials and utilities sectors overall compared to the benchmark, says MAS.
The EM benchmark itself did not see a significant reduction in WACI. There was a decline in the overall average carbon intensity of EM companies, but this was less pronounced than that seen for DM companies, reflecting “slower decarbonisation progress in emerging markets”, says MAS.
“This reduction, however, was offset by an increase in the weights of the benchmark constituents of more carbo-nintensive companies, reflecting their increase in market capitalisation over the year,” adds MAS.
MAS’s corporate bonds portfolio
Corporate bonds are relatively less impacted by transition risks than equities, since bonds generally have shorter, fixed tenures, says MAS. In addition, investors in corporate bonds bear less risk as creditors sit higher up the capital structure relative to equity shareholders, and suffer losses only after equity shareholders, adds MAS.
The WACI for MAS’s corporate bonds portfolio decreased in conjunction with the corporate bond benchmark from FY2022/2023 to FY2023/2024, with the WACI for MAS’s corporate bonds portfolio decreasing at a faster pace.
As the corporate bonds portfolio comprises mainly DM issuers, MAS reports WACI of the portfolio against the WACI of a broad investment grade corporate bond benchmark.
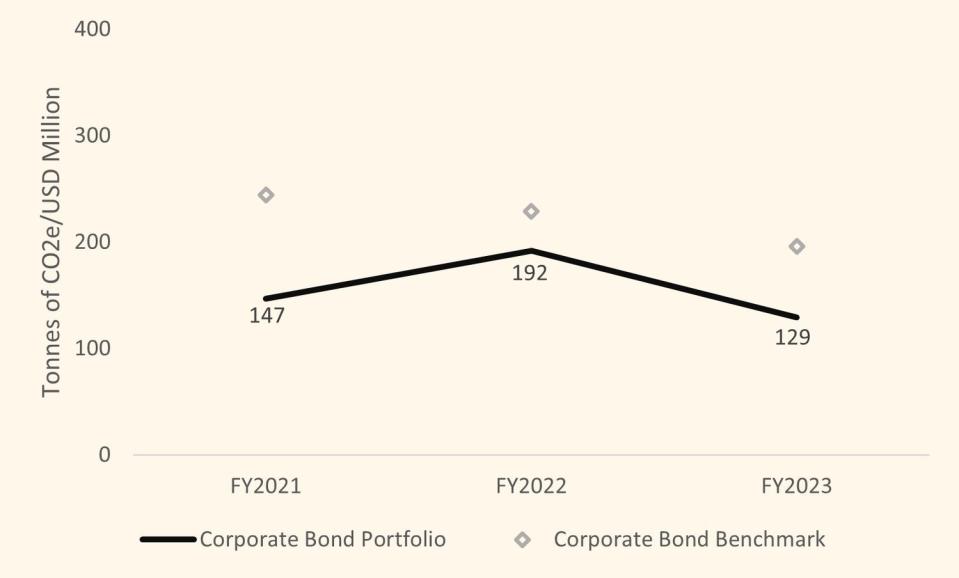
Relative to the benchmark, MAS’s corporate bonds portfolio saw a larger reduction in WACI due to active investment allocation by MAS’s external managers for corporate bonds, which resulted in a reduction in exposure to corporate bonds by utilities issuers. This had been the reason for the higher portfolio WACI in FY2022/2023 compared to FY2021/2022.
“As the portfolio is actively managed by our external managers, the WACI of the portfolio relative to benchmark is expected to fluctuate subject to active investment allocation across corporate bonds issuance by the managers,” says MAS.
The WACI for MAS’s corporate bonds portfolio continues to be lower than its benchmark from FY2022/2023 to FY2023/2024. “The lower WACI was due to MAS’s portfolio construction framework, which screens out debt securities with smaller issuance sizes, which are also in more carbon-intensive sectors,” says MAS. “As a result, the portfolio has a lower exposure to debt securities issued by companies in carbon-intensive sectors relative to the market benchmark.”
Scope 1 and 2 emissions only
MAS only considered Scope 1 and Scope 2 emissions of the companies in its equities and corporate bonds portfolio, weighted by the size of the investment in the company in relation to the size of the equities or corporate bonds portfolios.
Scope 1 and 2 emissions represent the direct emissions of greenhouse gas controlled and produced by the company and the indirect emissions of greenhouse gas from the consumption of purchased electricity, heat, or steam by the company respectively.
MAS does not include Scope 3 emissions, which refer to all other indirect emissions occurring in the value chain of the company, as the level of reporting of Scope 3 emissions by companies remains low today, therefore requiring a larger degree of estimation; and the inclusion of Scope 3 emissions would result in double counting when emissions statistics are aggregated at the portfolio level.
MAS says it is developing capabilities to measure and analyse portfolio climate risks using “other relevant emissions-based and forward-looking metrics” and will consider including these metrics in future reports.
Charts: MAS
See Also:
Click here to stay updated with the Latest Business & Investment News in Singapore
What’s behind CDL’s ‘first-of-its-kind’ $400 mil sustainability-linked loan?
Sustainability reporting ‘not a trivial exercise’: EnterpriseSG chairman
Get in-depth insights from our expert contributors, and dive into financial and economic trends