
 Yahoo Finance
 Mandarin Oriental International (SGX:M04) Will Be Hoping To Turn Its Returns On Capital Around
Finding a business that has the potential to grow substantially is not easy, but it is possible if we look at a few key financial metrics. In a perfect world, we'd like to see a company investing more capital into its business and ideally the returns earned from that capital are also increasing. If you see this, it typically means it's a company with a great business model and plenty of profitable reinvestment opportunities. Although, when we looked at Mandarin Oriental International (SGX:M04), it didn't seem to tick all of these boxes.
Return On Capital Employed (ROCE): What Is It?
If you haven't worked with ROCE before, it measures the 'return' (pre-tax profit) a company generates from capital employed in its business. The formula for this calculation on Mandarin Oriental International is:
Return on Capital Employed = Earnings Before Interest and Tax (EBIT) ÷ (Total Assets - Current Liabilities)
0.033 = US$102m ÷ (US$3.7b - US$625m) (Based on the trailing twelve months to December 2023).
So, Mandarin Oriental International has an ROCE of 3.3%. Ultimately, that's a low return and it under-performs the Hospitality industry average of 4.5%.
Check out our latest analysis for Mandarin Oriental International
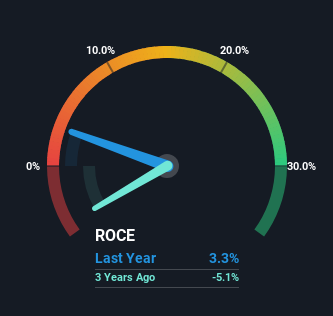
Historical performance is a great place to start when researching a stock so above you can see the gauge for Mandarin Oriental International's ROCE against it's prior returns. If you're interested in investigating Mandarin Oriental International's past further, check out this free graph covering Mandarin Oriental International's past earnings, revenue and cash flow.
What Does the ROCE Trend For Mandarin Oriental International Tell Us?
In terms of Mandarin Oriental International's historical ROCE movements, the trend isn't fantastic. To be more specific, ROCE has fallen from 6.3% over the last five years. However, given capital employed and revenue have both increased it appears that the business is currently pursuing growth, at the consequence of short term returns. And if the increased capital generates additional returns, the business, and thus shareholders, will benefit in the long run.
On a related note, Mandarin Oriental International has decreased its current liabilities to 17% of total assets. That could partly explain why the ROCE has dropped. What's more, this can reduce some aspects of risk to the business because now the company's suppliers or short-term creditors are funding less of its operations. Since the business is basically funding more of its operations with it's own money, you could argue this has made the business less efficient at generating ROCE.
What We Can Learn From Mandarin Oriental International's ROCE
Even though returns on capital have fallen in the short term, we find it promising that revenue and capital employed have both increased for Mandarin Oriental International. In light of this, the stock has only gained 3.1% over the last five years. So this stock may still be an appealing investment opportunity, if other fundamentals prove to be sound.
Mandarin Oriental International does have some risks, we noticed 2 warning signs (and 1 which shouldn't be ignored) we think you should know about.
For those who like to invest in solid companies, check out this free list of companies with solid balance sheets and high returns on equity.
Have feedback on this article? Concerned about the content? Get in touch with us directly. Alternatively, email editorial-team (at) simplywallst.com.
This article by Simply Wall St is general in nature. We provide commentary based on historical data and analyst forecasts only using an unbiased methodology and our articles are not intended to be financial advice. It does not constitute a recommendation to buy or sell any stock, and does not take account of your objectives, or your financial situation. We aim to bring you long-term focused analysis driven by fundamental data. Note that our analysis may not factor in the latest price-sensitive company announcements or qualitative material. Simply Wall St has no position in any stocks mentioned.
Have feedback on this article? Concerned about the content? Get in touch with us directly. Alternatively, email editorial-team@simplywallst.com
