
 Yahoo Finance
 Is Malaysian Pacific Industries Berhad's (KLSE:MPI) Stock Price Struggling As A Result Of Its Mixed Financials?
With its stock down 3.4% over the past month, it is easy to disregard Malaysian Pacific Industries Berhad (KLSE:MPI). It seems that the market might have completely ignored the positive aspects of the company's fundamentals and decided to weigh-in more on the negative aspects. Stock prices are usually driven by a company’s financial performance over the long term, and therefore we decided to pay more attention to the company's financial performance. Particularly, we will be paying attention to Malaysian Pacific Industries Berhad's ROE today.
Return on equity or ROE is an important factor to be considered by a shareholder because it tells them how effectively their capital is being reinvested. In other words, it is a profitability ratio which measures the rate of return on the capital provided by the company's shareholders.
See our latest analysis for Malaysian Pacific Industries Berhad
How To Calculate Return On Equity?
ROE can be calculated by using the formula:
Return on Equity = Net Profit (from continuing operations) ÷ Shareholders' Equity
So, based on the above formula, the ROE for Malaysian Pacific Industries Berhad is:
3.5% = RM86m ÷ RM2.4b (Based on the trailing twelve months to December 2023).
The 'return' is the profit over the last twelve months. That means that for every MYR1 worth of shareholders' equity, the company generated MYR0.04 in profit.
What Has ROE Got To Do With Earnings Growth?
We have already established that ROE serves as an efficient profit-generating gauge for a company's future earnings. We now need to evaluate how much profit the company reinvests or "retains" for future growth which then gives us an idea about the growth potential of the company. Generally speaking, other things being equal, firms with a high return on equity and profit retention, have a higher growth rate than firms that don’t share these attributes.
A Side By Side comparison of Malaysian Pacific Industries Berhad's Earnings Growth And 3.5% ROE
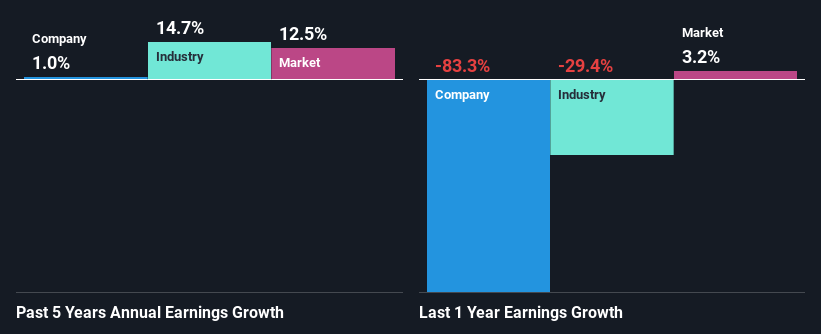
It is quite clear that Malaysian Pacific Industries Berhad's ROE is rather low. Not just that, even compared to the industry average of 7.0%, the company's ROE is entirely unremarkable. As a result, Malaysian Pacific Industries Berhad's flat earnings over the past five years doesn't come as a surprise given its lower ROE.
Next, on comparing with the industry net income growth, we found that Malaysian Pacific Industries Berhad's reported growth was lower than the industry growth of 15% over the last few years, which is not something we like to see.
Earnings growth is an important metric to consider when valuing a stock. The investor should try to establish if the expected growth or decline in earnings, whichever the case may be, is priced in. This then helps them determine if the stock is placed for a bright or bleak future. One good indicator of expected earnings growth is the P/E ratio which determines the price the market is willing to pay for a stock based on its earnings prospects. So, you may want to check if Malaysian Pacific Industries Berhad is trading on a high P/E or a low P/E, relative to its industry.
Is Malaysian Pacific Industries Berhad Efficiently Re-investing Its Profits?
Malaysian Pacific Industries Berhad has a low three-year median payout ratio of 24% (or a retention ratio of 76%) but the negligible earnings growth number doesn't reflect this as high growth usually follows high profit retention.
In addition, Malaysian Pacific Industries Berhad has been paying dividends over a period of at least ten years suggesting that keeping up dividend payments is way more important to the management even if it comes at the cost of business growth. Upon studying the latest analysts' consensus data, we found that the company is expected to keep paying out approximately 26% of its profits over the next three years. Regardless, the future ROE for Malaysian Pacific Industries Berhad is predicted to rise to 12% despite there being not much change expected in its payout ratio.
Conclusion
On the whole, we feel that the performance shown by Malaysian Pacific Industries Berhad can be open to many interpretations. While the company does have a high rate of profit retention, its low rate of return is probably hampering its earnings growth. With that said, the latest industry analyst forecasts reveal that the company's earnings are expected to accelerate. To know more about the latest analysts predictions for the company, check out this visualization of analyst forecasts for the company.
Have feedback on this article? Concerned about the content? Get in touch with us directly. Alternatively, email editorial-team (at) simplywallst.com.
This article by Simply Wall St is general in nature. We provide commentary based on historical data and analyst forecasts only using an unbiased methodology and our articles are not intended to be financial advice. It does not constitute a recommendation to buy or sell any stock, and does not take account of your objectives, or your financial situation. We aim to bring you long-term focused analysis driven by fundamental data. Note that our analysis may not factor in the latest price-sensitive company announcements or qualitative material. Simply Wall St has no position in any stocks mentioned.
