
 Yahoo Finance
 Lords Group Trading's (LON:LORD) Returns On Capital Are Heading Higher
If you're looking for a multi-bagger, there's a few things to keep an eye out for. Typically, we'll want to notice a trend of growing return on capital employed (ROCE) and alongside that, an expanding base of capital employed. Basically this means that a company has profitable initiatives that it can continue to reinvest in, which is a trait of a compounding machine. So when we looked at Lords Group Trading (LON:LORD) and its trend of ROCE, we really liked what we saw.
What Is Return On Capital Employed (ROCE)?
If you haven't worked with ROCE before, it measures the 'return' (pre-tax profit) a company generates from capital employed in its business. To calculate this metric for Lords Group Trading, this is the formula:
Return on Capital Employed = Earnings Before Interest and Tax (EBIT) ÷ (Total Assets - Current Liabilities)
0.12 = UK£17m ÷ (UK£240m - UK£94m) (Based on the trailing twelve months to June 2023).
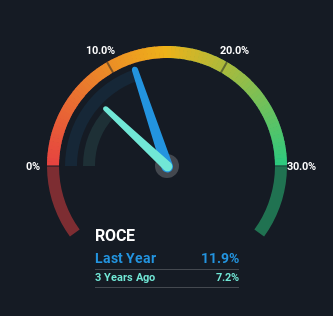
Therefore, Lords Group Trading has an ROCE of 12%. In absolute terms, that's a pretty normal return, and it's somewhat close to the Trade Distributors industry average of 15%.
See our latest analysis for Lords Group Trading
Above you can see how the current ROCE for Lords Group Trading compares to its prior returns on capital, but there's only so much you can tell from the past. If you'd like, you can check out the forecasts from the analysts covering Lords Group Trading for free.
What Does the ROCE Trend For Lords Group Trading Tell Us?
The trends we've noticed at Lords Group Trading are quite reassuring. The data shows that returns on capital have increased substantially over the last four years to 12%. Basically the business is earning more per dollar of capital invested and in addition to that, 514% more capital is being employed now too. The increasing returns on a growing amount of capital is common amongst multi-baggers and that's why we're impressed.
One more thing to note, Lords Group Trading has decreased current liabilities to 39% of total assets over this period, which effectively reduces the amount of funding from suppliers or short-term creditors. This tells us that Lords Group Trading has grown its returns without a reliance on increasing their current liabilities, which we're very happy with.
The Bottom Line On Lords Group Trading's ROCE
In summary, it's great to see that Lords Group Trading can compound returns by consistently reinvesting capital at increasing rates of return, because these are some of the key ingredients of those highly sought after multi-baggers. Given the stock has declined 29% in the last year, this could be a good investment if the valuation and other metrics are also appealing. With that in mind, we believe the promising trends warrant this stock for further investigation.
If you'd like to know about the risks facing Lords Group Trading, we've discovered 3 warning signs that you should be aware of.
If you want to search for solid companies with great earnings, check out this free list of companies with good balance sheets and impressive returns on equity.
Have feedback on this article? Concerned about the content? Get in touch with us directly. Alternatively, email editorial-team (at) simplywallst.com.
This article by Simply Wall St is general in nature. We provide commentary based on historical data and analyst forecasts only using an unbiased methodology and our articles are not intended to be financial advice. It does not constitute a recommendation to buy or sell any stock, and does not take account of your objectives, or your financial situation. We aim to bring you long-term focused analysis driven by fundamental data. Note that our analysis may not factor in the latest price-sensitive company announcements or qualitative material. Simply Wall St has no position in any stocks mentioned.
