
 Yahoo Finance
 A Look Into Kainos Group's (LON:KNOS) Impressive Returns On Capital
Did you know there are some financial metrics that can provide clues of a potential multi-bagger? Firstly, we'll want to see a proven return on capital employed (ROCE) that is increasing, and secondly, an expanding base of capital employed. Basically this means that a company has profitable initiatives that it can continue to reinvest in, which is a trait of a compounding machine. With that in mind, the ROCE of Kainos Group (LON:KNOS) looks attractive right now, so lets see what the trend of returns can tell us.
Understanding Return On Capital Employed (ROCE)
Just to clarify if you're unsure, ROCE is a metric for evaluating how much pre-tax income (in percentage terms) a company earns on the capital invested in its business. Analysts use this formula to calculate it for Kainos Group:
Return on Capital Employed = Earnings Before Interest and Tax (EBIT) ÷ (Total Assets - Current Liabilities)
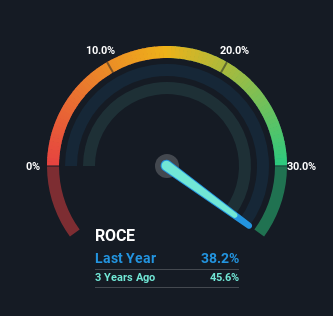
0.38 = UK£54m ÷ (UK£268m - UK£127m) (Based on the trailing twelve months to September 2023).
So, Kainos Group has an ROCE of 38%. In absolute terms that's a great return and it's even better than the IT industry average of 18%.
See our latest analysis for Kainos Group
Above you can see how the current ROCE for Kainos Group compares to its prior returns on capital, but there's only so much you can tell from the past. If you'd like to see what analysts are forecasting going forward, you should check out our free analyst report for Kainos Group .
How Are Returns Trending?
It's hard not to be impressed by Kainos Group's returns on capital. The company has consistently earned 38% for the last five years, and the capital employed within the business has risen 206% in that time. Now considering ROCE is an attractive 38%, this combination is actually pretty appealing because it means the business can consistently put money to work and generate these high returns. If Kainos Group can keep this up, we'd be very optimistic about its future.
On a side note, Kainos Group's current liabilities are still rather high at 47% of total assets. This effectively means that suppliers (or short-term creditors) are funding a large portion of the business, so just be aware that this can introduce some elements of risk. While it's not necessarily a bad thing, it can be beneficial if this ratio is lower.
The Bottom Line
In short, we'd argue Kainos Group has the makings of a multi-bagger since its been able to compound its capital at very profitable rates of return. And the stock has done incredibly well with a 149% return over the last five years, so long term investors are no doubt ecstatic with that result. So while the positive underlying trends may be accounted for by investors, we still think this stock is worth looking into further.
On a separate note, we've found 1 warning sign for Kainos Group you'll probably want to know about.
If you want to search for more stocks that have been earning high returns, check out this free list of stocks with solid balance sheets that are also earning high returns on equity.
Have feedback on this article? Concerned about the content? Get in touch with us directly. Alternatively, email editorial-team (at) simplywallst.com.
This article by Simply Wall St is general in nature. We provide commentary based on historical data and analyst forecasts only using an unbiased methodology and our articles are not intended to be financial advice. It does not constitute a recommendation to buy or sell any stock, and does not take account of your objectives, or your financial situation. We aim to bring you long-term focused analysis driven by fundamental data. Note that our analysis may not factor in the latest price-sensitive company announcements or qualitative material. Simply Wall St has no position in any stocks mentioned.
