
 Yahoo Finance
 A Look At The Intrinsic Value Of W T K Holdings Berhad (KLSE:WTK)
Key Insights
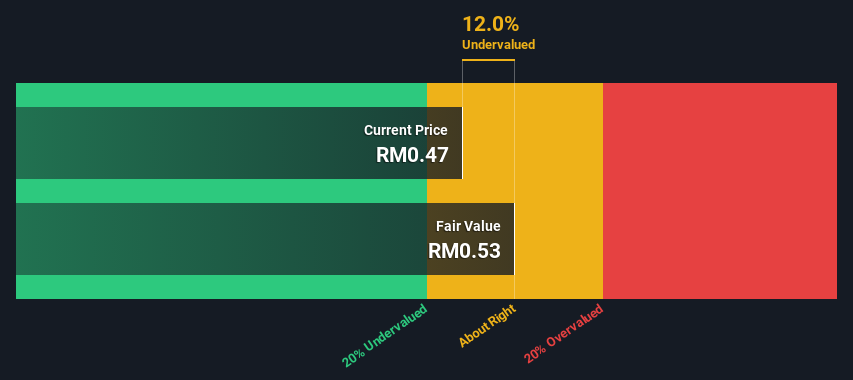
The projected fair value for W T K Holdings Berhad is RM0.53 based on 2 Stage Free Cash Flow to Equity
With RM0.47 share price, W T K Holdings Berhad appears to be trading close to its estimated fair value
Peers of W T K Holdings Berhad are currently trading on average at a 119% premium
Today we will run through one way of estimating the intrinsic value of W T K Holdings Berhad (KLSE:WTK) by projecting its future cash flows and then discounting them to today's value. One way to achieve this is by employing the Discounted Cash Flow (DCF) model. Before you think you won't be able to understand it, just read on! It's actually much less complex than you'd imagine.
Companies can be valued in a lot of ways, so we would point out that a DCF is not perfect for every situation. For those who are keen learners of equity analysis, the Simply Wall St analysis model here may be something of interest to you.
View our latest analysis for W T K Holdings Berhad
Step By Step Through The Calculation
We are going to use a two-stage DCF model, which, as the name states, takes into account two stages of growth. The first stage is generally a higher growth period which levels off heading towards the terminal value, captured in the second 'steady growth' period. In the first stage we need to estimate the cash flows to the business over the next ten years. Seeing as no analyst estimates of free cash flow are available to us, we have extrapolate the previous free cash flow (FCF) from the company's last reported value. We assume companies with shrinking free cash flow will slow their rate of shrinkage, and that companies with growing free cash flow will see their growth rate slow, over this period. We do this to reflect that growth tends to slow more in the early years than it does in later years.
Generally we assume that a dollar today is more valuable than a dollar in the future, so we need to discount the sum of these future cash flows to arrive at a present value estimate:
10-year free cash flow (FCF) estimate
2024 | 2025 | 2026 | 2027 | 2028 | 2029 | 2030 | 2031 | 2032 | 2033 | |
Levered FCF (MYR, Millions) | RM35.8m | RM36.3m | RM37.0m | RM37.9m | RM39.0m | RM40.2m | RM41.4m | RM42.8m | RM44.2m | RM45.8m |
Growth Rate Estimate Source | Est @ 0.37% | Est @ 1.32% | Est @ 1.99% | Est @ 2.46% | Est @ 2.79% | Est @ 3.02% | Est @ 3.18% | Est @ 3.29% | Est @ 3.37% | Est @ 3.42% |
Present Value (MYR, Millions) Discounted @ 17% | RM30.6 | RM26.4 | RM23.0 | RM20.1 | RM17.6 | RM15.5 | RM13.6 | RM12.0 | RM10.6 | RM9.4 |
("Est" = FCF growth rate estimated by Simply Wall St)
Present Value of 10-year Cash Flow (PVCF) = RM179m
The second stage is also known as Terminal Value, this is the business's cash flow after the first stage. The Gordon Growth formula is used to calculate Terminal Value at a future annual growth rate equal to the 5-year average of the 10-year government bond yield of 3.6%. We discount the terminal cash flows to today's value at a cost of equity of 17%.
Terminal Value (TV)= FCF2033 × (1 + g) ÷ (r – g) = RM46m× (1 + 3.6%) ÷ (17%– 3.6%) = RM347m
Present Value of Terminal Value (PVTV)= TV / (1 + r)10= RM347m÷ ( 1 + 17%)10= RM71m
The total value is the sum of cash flows for the next ten years plus the discounted terminal value, which results in the Total Equity Value, which in this case is RM250m. In the final step we divide the equity value by the number of shares outstanding. Compared to the current share price of RM0.5, the company appears about fair value at a 12% discount to where the stock price trades currently. Remember though, that this is just an approximate valuation, and like any complex formula - garbage in, garbage out.
Important Assumptions
The calculation above is very dependent on two assumptions. The first is the discount rate and the other is the cash flows. You don't have to agree with these inputs, I recommend redoing the calculations yourself and playing with them. The DCF also does not consider the possible cyclicality of an industry, or a company's future capital requirements, so it does not give a full picture of a company's potential performance. Given that we are looking at W T K Holdings Berhad as potential shareholders, the cost of equity is used as the discount rate, rather than the cost of capital (or weighted average cost of capital, WACC) which accounts for debt. In this calculation we've used 17%, which is based on a levered beta of 2.000. Beta is a measure of a stock's volatility, compared to the market as a whole. We get our beta from the industry average beta of globally comparable companies, with an imposed limit between 0.8 and 2.0, which is a reasonable range for a stable business.
SWOT Analysis for W T K Holdings Berhad
Strength
Net debt to equity ratio below 40%.
Weakness
Dividend is low compared to the top 25% of dividend payers in the Forestry market.
Opportunity
Has sufficient cash runway for more than 3 years based on current free cash flows.
Current share price is below our estimate of fair value.
Lack of analyst coverage makes it difficult to determine WTK's earnings prospects.
Threat
Debt is not well covered by operating cash flow.
Paying a dividend but company is unprofitable.
Moving On:
Whilst important, the DCF calculation is only one of many factors that you need to assess for a company. DCF models are not the be-all and end-all of investment valuation. Instead the best use for a DCF model is to test certain assumptions and theories to see if they would lead to the company being undervalued or overvalued. If a company grows at a different rate, or if its cost of equity or risk free rate changes sharply, the output can look very different. For W T K Holdings Berhad, we've compiled three further items you should explore:
Risks: For instance, we've identified 2 warning signs for W T K Holdings Berhad (1 is concerning) you should be aware of.
Other High Quality Alternatives: Do you like a good all-rounder? Explore our interactive list of high quality stocks to get an idea of what else is out there you may be missing!
Other Environmentally-Friendly Companies: Concerned about the environment and think consumers will buy eco-friendly products more and more? Browse through our interactive list of companies that are thinking about a greener future to discover some stocks you may not have thought of!
PS. Simply Wall St updates its DCF calculation for every Malaysian stock every day, so if you want to find the intrinsic value of any other stock just search here.
Have feedback on this article? Concerned about the content? Get in touch with us directly. Alternatively, email editorial-team (at) simplywallst.com.
This article by Simply Wall St is general in nature. We provide commentary based on historical data and analyst forecasts only using an unbiased methodology and our articles are not intended to be financial advice. It does not constitute a recommendation to buy or sell any stock, and does not take account of your objectives, or your financial situation. We aim to bring you long-term focused analysis driven by fundamental data. Note that our analysis may not factor in the latest price-sensitive company announcements or qualitative material. Simply Wall St has no position in any stocks mentioned.
