
 Yahoo Finance
 LexinFintech Holdings (NASDAQ:LX) investors are sitting on a loss of 83% if they invested five years ago
LexinFintech Holdings Ltd. (NASDAQ:LX) shareholders should be happy to see the share price up 13% in the last month. But will that heal all the wounds inflicted over 5 years of declines? Unlikely. Indeed, the share price is down a whopping 84% in that time. While the recent increase might be a green shoot, we're certainly hesitant to rejoice. The million dollar question is whether the company can justify a long term recovery. While a drop like that is definitely a body blow, money isn't as important as health and happiness.
So let's have a look and see if the longer term performance of the company has been in line with the underlying business' progress.
See our latest analysis for LexinFintech Holdings
While markets are a powerful pricing mechanism, share prices reflect investor sentiment, not just underlying business performance. By comparing earnings per share (EPS) and share price changes over time, we can get a feel for how investor attitudes to a company have morphed over time.
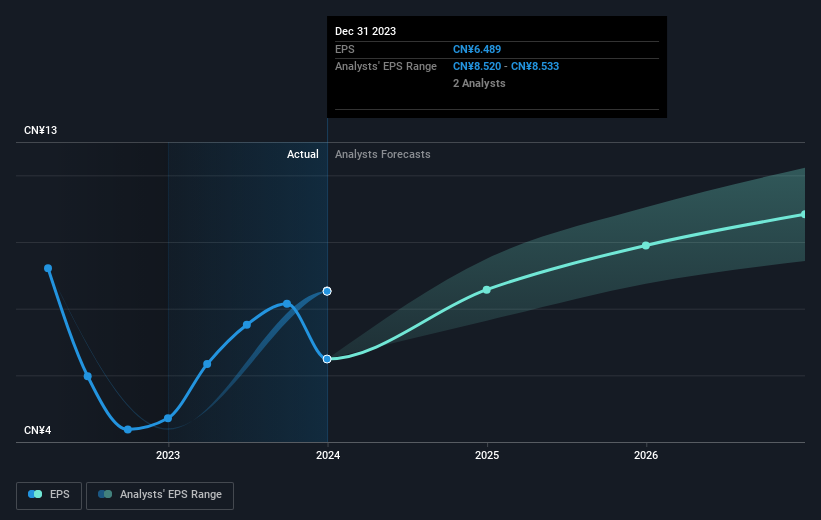
Looking back five years, both LexinFintech Holdings' share price and EPS declined; the latter at a rate of 11% per year. This reduction in EPS is less than the 31% annual reduction in the share price. This implies that the market was previously too optimistic about the stock. The less favorable sentiment is reflected in its current P/E ratio of 2.09.
The graphic below depicts how EPS has changed over time (unveil the exact values by clicking on the image).
We know that LexinFintech Holdings has improved its bottom line lately, but is it going to grow revenue? This free report showing analyst revenue forecasts should help you figure out if the EPS growth can be sustained.
A Different Perspective
Investors in LexinFintech Holdings had a tough year, with a total loss of 12% (including dividends), against a market gain of about 30%. Even the share prices of good stocks drop sometimes, but we want to see improvements in the fundamental metrics of a business, before getting too interested. Unfortunately, longer term shareholders are suffering worse, given the loss of 13% doled out over the last five years. We would want clear information suggesting the company will grow, before taking the view that the share price will stabilize. I find it very interesting to look at share price over the long term as a proxy for business performance. But to truly gain insight, we need to consider other information, too. Consider risks, for instance. Every company has them, and we've spotted 1 warning sign for LexinFintech Holdings you should know about.
We will like LexinFintech Holdings better if we see some big insider buys. While we wait, check out this free list of undervalued stocks (mostly small caps) with considerable, recent, insider buying.
Please note, the market returns quoted in this article reflect the market weighted average returns of stocks that currently trade on American exchanges.
Have feedback on this article? Concerned about the content? Get in touch with us directly. Alternatively, email editorial-team (at) simplywallst.com.
This article by Simply Wall St is general in nature. We provide commentary based on historical data and analyst forecasts only using an unbiased methodology and our articles are not intended to be financial advice. It does not constitute a recommendation to buy or sell any stock, and does not take account of your objectives, or your financial situation. We aim to bring you long-term focused analysis driven by fundamental data. Note that our analysis may not factor in the latest price-sensitive company announcements or qualitative material. Simply Wall St has no position in any stocks mentioned.
