
 Yahoo Finance
 Leong Hup International Berhad (KLSE:LHI) Is Experiencing Growth In Returns On Capital
There are a few key trends to look for if we want to identify the next multi-bagger. One common approach is to try and find a company with returns on capital employed (ROCE) that are increasing, in conjunction with a growing amount of capital employed. Ultimately, this demonstrates that it's a business that is reinvesting profits at increasing rates of return. So when we looked at Leong Hup International Berhad (KLSE:LHI) and its trend of ROCE, we really liked what we saw.
Understanding Return On Capital Employed (ROCE)
For those who don't know, ROCE is a measure of a company's yearly pre-tax profit (its return), relative to the capital employed in the business. To calculate this metric for Leong Hup International Berhad, this is the formula:
Return on Capital Employed = Earnings Before Interest and Tax (EBIT) ÷ (Total Assets - Current Liabilities)
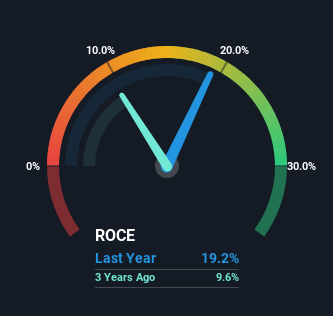
0.19 = RM806m ÷ (RM6.6b - RM2.4b) (Based on the trailing twelve months to March 2024).
So, Leong Hup International Berhad has an ROCE of 19%. In absolute terms, that's a satisfactory return, but compared to the Food industry average of 6.9% it's much better.
See our latest analysis for Leong Hup International Berhad
Above you can see how the current ROCE for Leong Hup International Berhad compares to its prior returns on capital, but there's only so much you can tell from the past. If you'd like to see what analysts are forecasting going forward, you should check out our free analyst report for Leong Hup International Berhad .
What Can We Tell From Leong Hup International Berhad's ROCE Trend?
We like the trends that we're seeing from Leong Hup International Berhad. The numbers show that in the last five years, the returns generated on capital employed have grown considerably to 19%. The amount of capital employed has increased too, by 35%. So we're very much inspired by what we're seeing at Leong Hup International Berhad thanks to its ability to profitably reinvest capital.
The Key Takeaway
In summary, it's great to see that Leong Hup International Berhad can compound returns by consistently reinvesting capital at increasing rates of return, because these are some of the key ingredients of those highly sought after multi-baggers. Given the stock has declined 26% in the last five years, this could be a good investment if the valuation and other metrics are also appealing. With that in mind, we believe the promising trends warrant this stock for further investigation.
Leong Hup International Berhad does come with some risks though, we found 3 warning signs in our investment analysis, and 1 of those is significant...
While Leong Hup International Berhad may not currently earn the highest returns, we've compiled a list of companies that currently earn more than 25% return on equity. Check out this free list here.
Have feedback on this article? Concerned about the content? Get in touch with us directly. Alternatively, email editorial-team (at) simplywallst.com.
This article by Simply Wall St is general in nature. We provide commentary based on historical data and analyst forecasts only using an unbiased methodology and our articles are not intended to be financial advice. It does not constitute a recommendation to buy or sell any stock, and does not take account of your objectives, or your financial situation. We aim to bring you long-term focused analysis driven by fundamental data. Note that our analysis may not factor in the latest price-sensitive company announcements or qualitative material. Simply Wall St has no position in any stocks mentioned.
Have feedback on this article? Concerned about the content? Get in touch with us directly. Alternatively, email editorial-team@simplywallst.com
