
 Yahoo Finance
 LaserBond (ASX:LBL) Is Reinvesting At Lower Rates Of Return
Finding a business that has the potential to grow substantially is not easy, but it is possible if we look at a few key financial metrics. Amongst other things, we'll want to see two things; firstly, a growing return on capital employed (ROCE) and secondly, an expansion in the company's amount of capital employed. Put simply, these types of businesses are compounding machines, meaning they are continually reinvesting their earnings at ever-higher rates of return. Although, when we looked at LaserBond (ASX:LBL), it didn't seem to tick all of these boxes.
What Is Return On Capital Employed (ROCE)?
For those who don't know, ROCE is a measure of a company's yearly pre-tax profit (its return), relative to the capital employed in the business. The formula for this calculation on LaserBond is:
Return on Capital Employed = Earnings Before Interest and Tax (EBIT) ÷ (Total Assets - Current Liabilities)
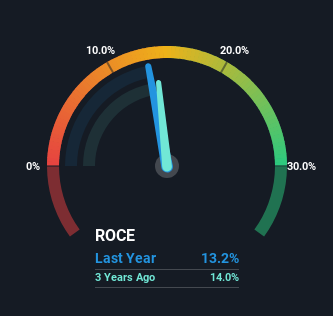
0.13 = AU$6.1m ÷ (AU$55m - AU$8.7m) (Based on the trailing twelve months to December 2023).
So, LaserBond has an ROCE of 13%. By itself that's a normal return on capital and it's in line with the industry's average returns of 13%.
See our latest analysis for LaserBond
In the above chart we have measured LaserBond's prior ROCE against its prior performance, but the future is arguably more important. If you'd like, you can check out the forecasts from the analysts covering LaserBond for free.
How Are Returns Trending?
When we looked at the ROCE trend at LaserBond, we didn't gain much confidence. To be more specific, ROCE has fallen from 21% over the last five years. However, given capital employed and revenue have both increased it appears that the business is currently pursuing growth, at the consequence of short term returns. If these investments prove successful, this can bode very well for long term stock performance.
On a related note, LaserBond has decreased its current liabilities to 16% of total assets. That could partly explain why the ROCE has dropped. Effectively this means their suppliers or short-term creditors are funding less of the business, which reduces some elements of risk. Some would claim this reduces the business' efficiency at generating ROCE since it is now funding more of the operations with its own money.
Our Take On LaserBond's ROCE
In summary, despite lower returns in the short term, we're encouraged to see that LaserBond is reinvesting for growth and has higher sales as a result. And the stock has followed suit returning a meaningful 99% to shareholders over the last five years. So should these growth trends continue, we'd be optimistic on the stock going forward.
One more thing, we've spotted 2 warning signs facing LaserBond that you might find interesting.
For those who like to invest in solid companies, check out this free list of companies with solid balance sheets and high returns on equity.
Have feedback on this article? Concerned about the content? Get in touch with us directly. Alternatively, email editorial-team (at) simplywallst.com.
This article by Simply Wall St is general in nature. We provide commentary based on historical data and analyst forecasts only using an unbiased methodology and our articles are not intended to be financial advice. It does not constitute a recommendation to buy or sell any stock, and does not take account of your objectives, or your financial situation. We aim to bring you long-term focused analysis driven by fundamental data. Note that our analysis may not factor in the latest price-sensitive company announcements or qualitative material. Simply Wall St has no position in any stocks mentioned.
Have feedback on this article? Concerned about the content? Get in touch with us directly. Alternatively, email editorial-team@simplywallst.com
