
 Yahoo Finance
 Korn Ferry's (NYSE:KFY) investors will be pleased with their favorable 86% return over the last five years
When you buy and hold a stock for the long term, you definitely want it to provide a positive return. Better yet, you'd like to see the share price move up more than the market average. But Korn Ferry (NYSE:KFY) has fallen short of that second goal, with a share price rise of 74% over five years, which is below the market return. Some buyers are laughing, though, with an increase of 38% in the last year.
So let's investigate and see if the longer term performance of the company has been in line with the underlying business' progress.
Check out our latest analysis for Korn Ferry
While the efficient markets hypothesis continues to be taught by some, it has been proven that markets are over-reactive dynamic systems, and investors are not always rational. By comparing earnings per share (EPS) and share price changes over time, we can get a feel for how investor attitudes to a company have morphed over time.
Over half a decade, Korn Ferry managed to grow its earnings per share at 12% a year. That makes the EPS growth particularly close to the yearly share price growth of 12%. That suggests that the market sentiment around the company hasn't changed much over that time. Rather, the share price has approximately tracked EPS growth.
The graphic below depicts how EPS has changed over time (unveil the exact values by clicking on the image).
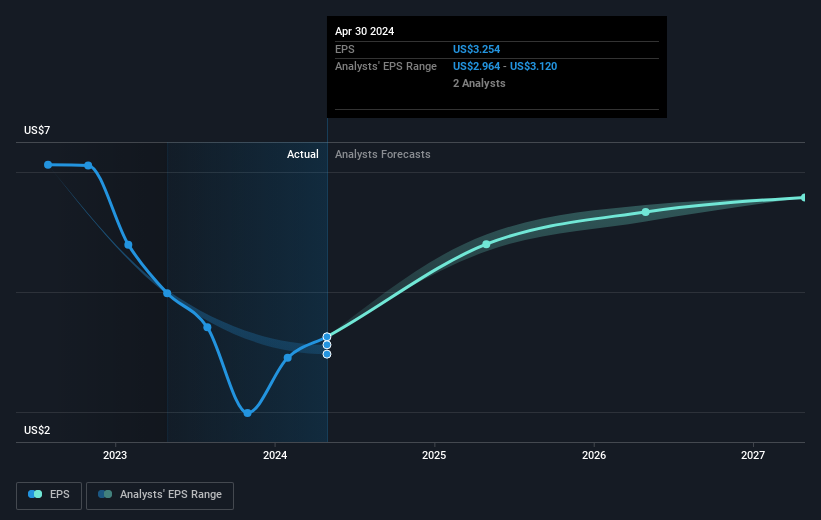
Dive deeper into Korn Ferry's key metrics by checking this interactive graph of Korn Ferry's earnings, revenue and cash flow.
What About Dividends?
When looking at investment returns, it is important to consider the difference between total shareholder return (TSR) and share price return. The TSR is a return calculation that accounts for the value of cash dividends (assuming that any dividend received was reinvested) and the calculated value of any discounted capital raisings and spin-offs. It's fair to say that the TSR gives a more complete picture for stocks that pay a dividend. We note that for Korn Ferry the TSR over the last 5 years was 86%, which is better than the share price return mentioned above. This is largely a result of its dividend payments!
A Different Perspective
We're pleased to report that Korn Ferry shareholders have received a total shareholder return of 41% over one year. And that does include the dividend. That gain is better than the annual TSR over five years, which is 13%. Therefore it seems like sentiment around the company has been positive lately. Given the share price momentum remains strong, it might be worth taking a closer look at the stock, lest you miss an opportunity. I find it very interesting to look at share price over the long term as a proxy for business performance. But to truly gain insight, we need to consider other information, too. For instance, we've identified 1 warning sign for Korn Ferry that you should be aware of.
If you are like me, then you will not want to miss this free list of undervalued small caps that insiders are buying.
Please note, the market returns quoted in this article reflect the market weighted average returns of stocks that currently trade on American exchanges.
Have feedback on this article? Concerned about the content? Get in touch with us directly. Alternatively, email editorial-team (at) simplywallst.com.
This article by Simply Wall St is general in nature. We provide commentary based on historical data and analyst forecasts only using an unbiased methodology and our articles are not intended to be financial advice. It does not constitute a recommendation to buy or sell any stock, and does not take account of your objectives, or your financial situation. We aim to bring you long-term focused analysis driven by fundamental data. Note that our analysis may not factor in the latest price-sensitive company announcements or qualitative material. Simply Wall St has no position in any stocks mentioned.
Have feedback on this article? Concerned about the content? Get in touch with us directly. Alternatively, email editorial-team@simplywallst.com
