
 Yahoo Finance
 Koppers Holdings' (NYSE:KOP) five-year total shareholder returns outpace the underlying earnings growth
While Koppers Holdings Inc. (NYSE:KOP) shareholders are probably generally happy, the stock hasn't had particularly good run recently, with the share price falling 26% in the last quarter. But at least the stock is up over the last five years. However we are not very impressed because the share price is only up 41%, less than the market return of 95%.
In light of the stock dropping 5.9% in the past week, we want to investigate the longer term story, and see if fundamentals have been the driver of the company's positive five-year return.
View our latest analysis for Koppers Holdings
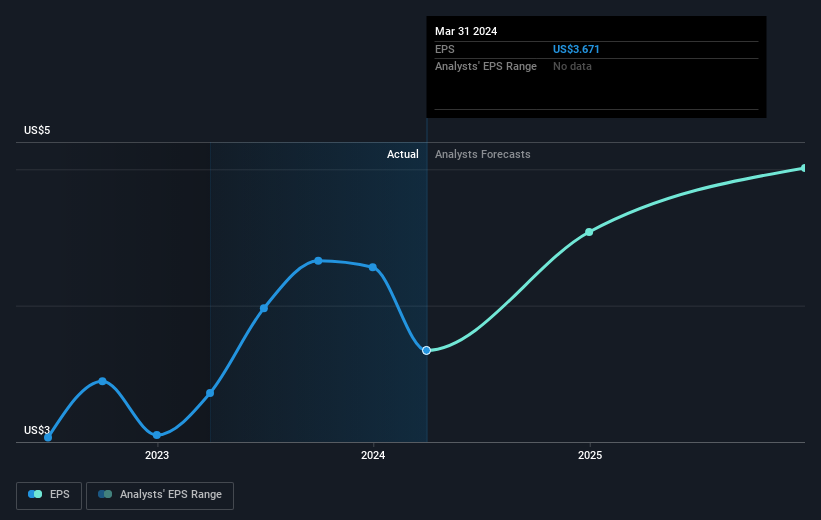
While markets are a powerful pricing mechanism, share prices reflect investor sentiment, not just underlying business performance. By comparing earnings per share (EPS) and share price changes over time, we can get a feel for how investor attitudes to a company have morphed over time.
Over half a decade, Koppers Holdings managed to grow its earnings per share at 40% a year. This EPS growth is higher than the 7% average annual increase in the share price. So it seems the market isn't so enthusiastic about the stock these days. The reasonably low P/E ratio of 10.82 also suggests market apprehension.
The graphic below depicts how EPS has changed over time (unveil the exact values by clicking on the image).
It might be well worthwhile taking a look at our free report on Koppers Holdings' earnings, revenue and cash flow.
What About Dividends?
It is important to consider the total shareholder return, as well as the share price return, for any given stock. The TSR is a return calculation that accounts for the value of cash dividends (assuming that any dividend received was reinvested) and the calculated value of any discounted capital raisings and spin-offs. It's fair to say that the TSR gives a more complete picture for stocks that pay a dividend. We note that for Koppers Holdings the TSR over the last 5 years was 43%, which is better than the share price return mentioned above. The dividends paid by the company have thusly boosted the total shareholder return.
A Different Perspective
Koppers Holdings shareholders gained a total return of 15% during the year. But that return falls short of the market. The silver lining is that the gain was actually better than the average annual return of 7% per year over five year. This suggests the company might be improving over time. It's always interesting to track share price performance over the longer term. But to understand Koppers Holdings better, we need to consider many other factors. Like risks, for instance. Every company has them, and we've spotted 2 warning signs for Koppers Holdings (of which 1 is potentially serious!) you should know about.
If you would prefer to check out another company -- one with potentially superior financials -- then do not miss this free list of companies that have proven they can grow earnings.
Please note, the market returns quoted in this article reflect the market weighted average returns of stocks that currently trade on American exchanges.
Have feedback on this article? Concerned about the content? Get in touch with us directly. Alternatively, email editorial-team (at) simplywallst.com.
This article by Simply Wall St is general in nature. We provide commentary based on historical data and analyst forecasts only using an unbiased methodology and our articles are not intended to be financial advice. It does not constitute a recommendation to buy or sell any stock, and does not take account of your objectives, or your financial situation. We aim to bring you long-term focused analysis driven by fundamental data. Note that our analysis may not factor in the latest price-sensitive company announcements or qualitative material. Simply Wall St has no position in any stocks mentioned.
Have feedback on this article? Concerned about the content? Get in touch with us directly. Alternatively, email editorial-team@simplywallst.com
