
 Yahoo Finance
 KBC Groupe NV's Dividend Analysis
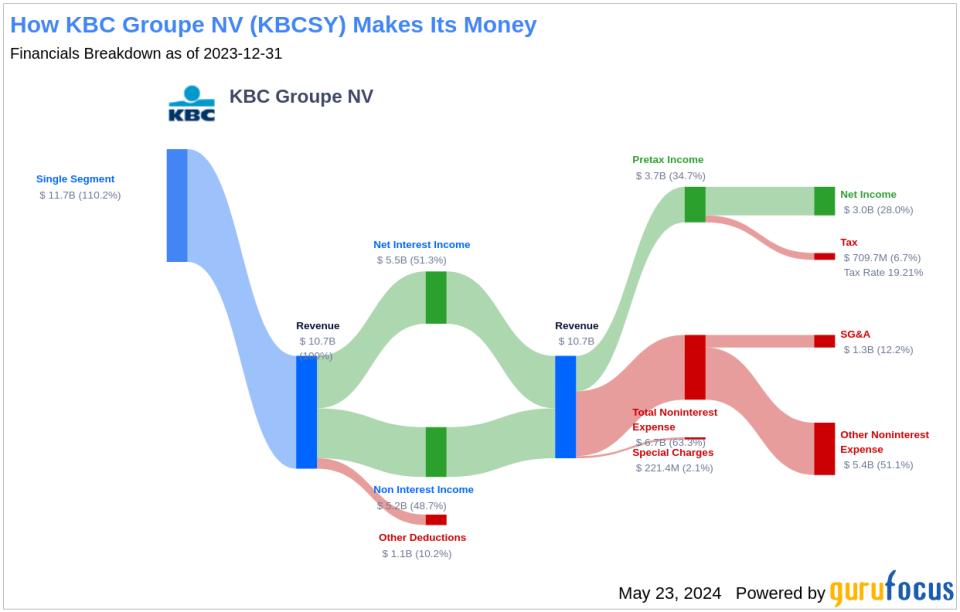
Understanding the Dividend Dynamics of KBC Groupe NV (KBCSY)
KBC Groupe NV (KBCSY) recently announced a dividend of $0.38 per share, payable on 2024-06-13, with the ex-dividend date set for 2024-05-24. As investors look forward to this upcoming payment, the spotlight also shines on the company's dividend history, yield, and growth rates. Using the data from GuruFocus, let's look into KBC Groupe NV's dividend performance and assess its sustainability.
What Does KBC Groupe NV Do?
This Powerful Chart Made Peter Lynch 29% A Year For 13 Years
How to calculate the intrinsic value of a stock?
KBC Groupe NV was formed in 1998 by the merger of Belgian commercial bank Kredietbank, cooperative farmers bank CERA Bank, and cooperative insurer ABB Verzekering. KBC offers banking, insurance, and investment products. Belgium and the Czech Republic account for most of KBC's profits, while the bank has smaller operations in Hungary, Slovakia, and Bulgaria.
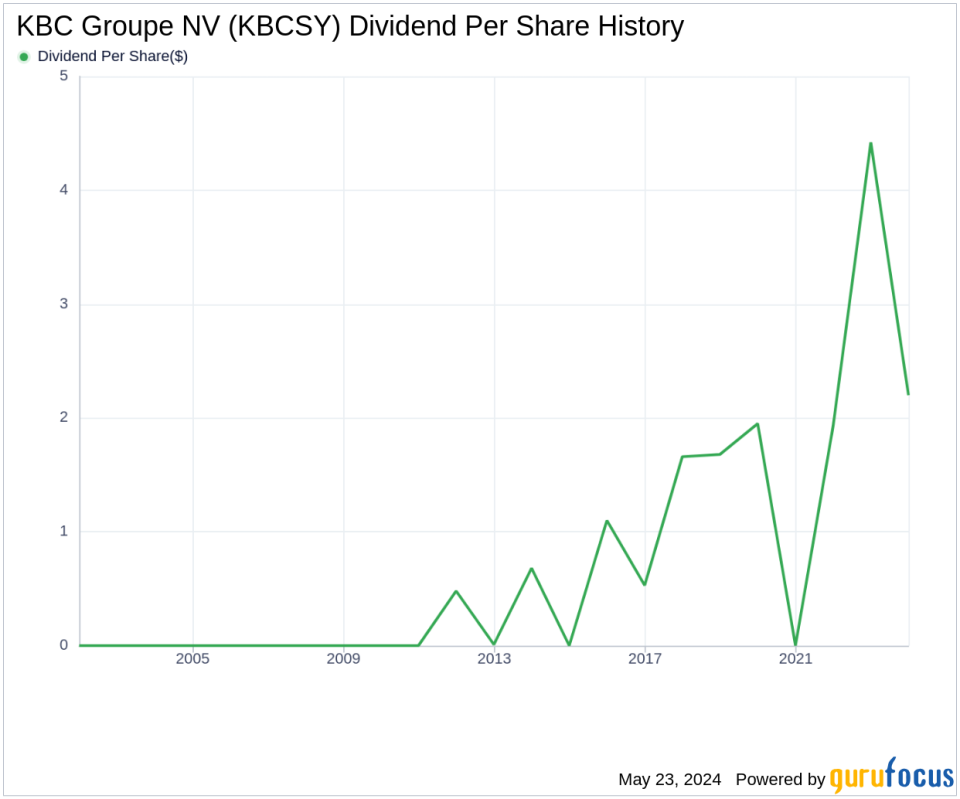
A Glimpse at KBC Groupe NV's Dividend History
KBC Groupe NV has maintained a consistent dividend payment record since 2021. Dividends are currently distributed on a bi-annually basis. Below is a chart showing annual Dividends Per Share for tracking historical trends.
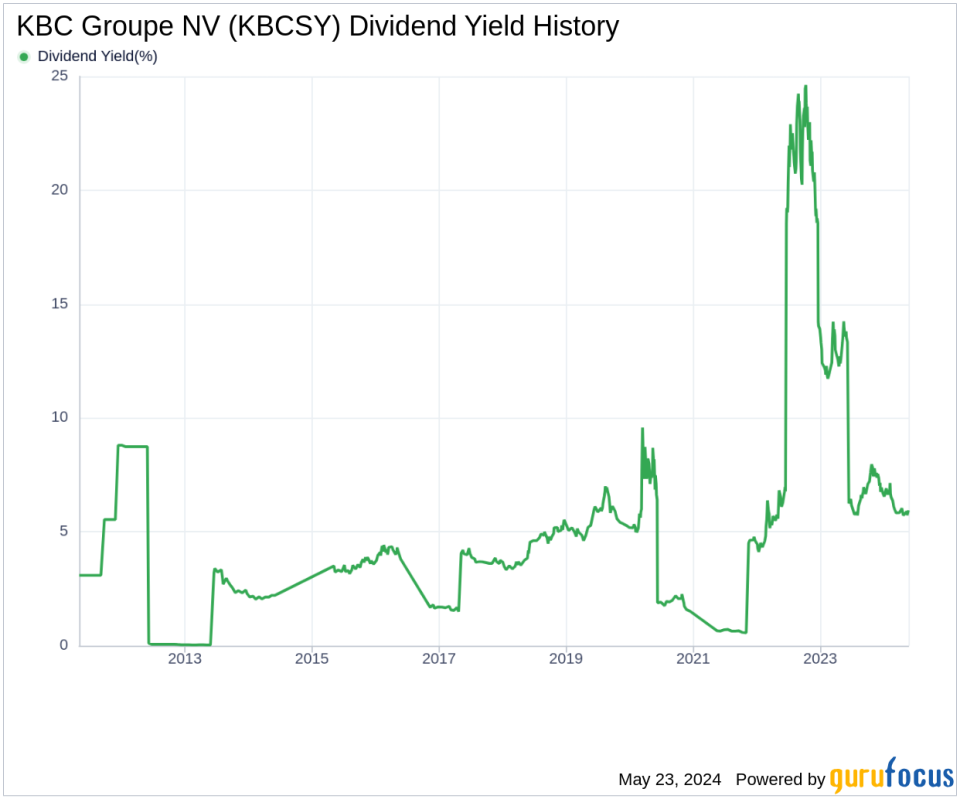
Breaking Down KBC Groupe NV's Dividend Yield and Growth
As of today, KBC Groupe NV currently has a 12-month trailing dividend yield of 6.13% and a 12-month forward dividend yield of 6.13%. This suggests an expectation of same dividend payments over the next 12 months. Based on KBC Groupe NV's dividend yield and five-year growth rate, the 5-year yield on cost of KBC Groupe NV stock as of today is approximately 6.13%.
The Sustainability Question: Payout Ratio and Profitability
To assess the sustainability of the dividend, one needs to evaluate the company's payout ratio. The dividend payout ratio provides insights into the portion of earnings the company distributes as dividends. A lower ratio suggests that the company retains a significant part of its earnings, thereby ensuring the availability of funds for future growth and unexpected downturns. As of 2024-03-31, KBC Groupe NV's dividend payout ratio is 0.54. KBC Groupe NV's profitability rank, offers an understanding of the company's earnings prowess relative to its peers. GuruFocus ranks KBC Groupe NV's profitability 5 out of 10 as of 2024-03-31, suggesting fair profitability. The company has reported positive net income for each of year over the past decade, further solidifying its high profitability.
Growth Metrics: The Future Outlook
To ensure the sustainability of dividends, a company must have robust growth metrics. KBC Groupe NV's growth rank of 5 out of 10 suggests that the company has a fair growth outlook. Revenue is the lifeblood of any company, and KBC Groupe NV's revenue per share, combined with the 3-year revenue growth rate, indicates a strong revenue model. KBC Groupe NV's revenue has increased by approximately 14.70% per year on average, a rate that outperforms approximately 75.46% of global competitors. The company's 3-year EPS growth rate showcases its capability to grow its earnings, a critical component for sustaining dividends in the long run. During the past three years, KBC Groupe NV's earnings increased by approximately 29.30% per year on average, a rate that outperforms approximately 73.29% of global competitors. Lastly, the company's 5-year EBITDA growth rate of 6.80%, which outperforms approximately 46.83% of global competitors.
Next Steps
Given KBC Groupe NV's robust dividend payments, consistent growth in earnings, and a prudent payout ratio, the company appears well-positioned to maintain its dividend payouts in the foreseeable future. Investors seeking to capitalize on steady income streams may find KBC Groupe NV an attractive option. For those looking to explore further, GuruFocus Premium users can screen for high-dividend yield stocks using the High Dividend Yield Screener.
This article, generated by GuruFocus, is designed to provide general insights and is not tailored financial advice. Our commentary is rooted in historical data and analyst projections, utilizing an impartial methodology, and is not intended to serve as specific investment guidance. It does not formulate a recommendation to purchase or divest any stock and does not consider individual investment objectives or financial circumstances. Our objective is to deliver long-term, fundamental data-driven analysis. Be aware that our analysis might not incorporate the most recent, price-sensitive company announcements or qualitative information. GuruFocus holds no position in the stocks mentioned herein.
This article first appeared on GuruFocus.
