
 Yahoo Finance
 Kanzhun (NASDAQ:BZ) Is Doing The Right Things To Multiply Its Share Price
What trends should we look for it we want to identify stocks that can multiply in value over the long term? Firstly, we'll want to see a proven return on capital employed (ROCE) that is increasing, and secondly, an expanding base of capital employed. Ultimately, this demonstrates that it's a business that is reinvesting profits at increasing rates of return. With that in mind, we've noticed some promising trends at Kanzhun (NASDAQ:BZ) so let's look a bit deeper.
Understanding Return On Capital Employed (ROCE)
For those who don't know, ROCE is a measure of a company's yearly pre-tax profit (its return), relative to the capital employed in the business. Analysts use this formula to calculate it for Kanzhun:
Return on Capital Employed = Earnings Before Interest and Tax (EBIT) ÷ (Total Assets - Current Liabilities)
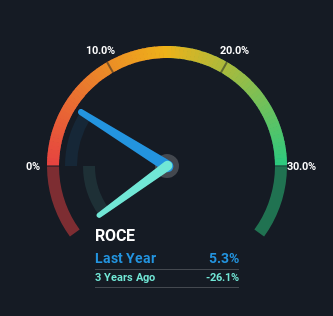
0.053 = CN¥762m ÷ (CN¥19b - CN¥4.5b) (Based on the trailing twelve months to March 2024).
So, Kanzhun has an ROCE of 5.3%. On its own, that's a low figure but it's around the 6.4% average generated by the Interactive Media and Services industry.
View our latest analysis for Kanzhun
Above you can see how the current ROCE for Kanzhun compares to its prior returns on capital, but there's only so much you can tell from the past. If you'd like, you can check out the forecasts from the analysts covering Kanzhun for free.
So How Is Kanzhun's ROCE Trending?
Kanzhun has recently broken into profitability so their prior investments seem to be paying off. About four years ago the company was generating losses but things have turned around because it's now earning 5.3% on its capital. Not only that, but the company is utilizing 856% more capital than before, but that's to be expected from a company trying to break into profitability. This can indicate that there's plenty of opportunities to invest capital internally and at ever higher rates, both common traits of a multi-bagger.
One more thing to note, Kanzhun has decreased current liabilities to 24% of total assets over this period, which effectively reduces the amount of funding from suppliers or short-term creditors. This tells us that Kanzhun has grown its returns without a reliance on increasing their current liabilities, which we're very happy with.
Our Take On Kanzhun's ROCE
To the delight of most shareholders, Kanzhun has now broken into profitability. And since the stock has fallen 40% over the last three years, there might be an opportunity here. With that in mind, we believe the promising trends warrant this stock for further investigation.
Before jumping to any conclusions though, we need to know what value we're getting for the current share price. That's where you can check out our FREE intrinsic value estimation for BZ that compares the share price and estimated value.
While Kanzhun isn't earning the highest return, check out this free list of companies that are earning high returns on equity with solid balance sheets.
Have feedback on this article? Concerned about the content? Get in touch with us directly. Alternatively, email editorial-team (at) simplywallst.com.
This article by Simply Wall St is general in nature. We provide commentary based on historical data and analyst forecasts only using an unbiased methodology and our articles are not intended to be financial advice. It does not constitute a recommendation to buy or sell any stock, and does not take account of your objectives, or your financial situation. We aim to bring you long-term focused analysis driven by fundamental data. Note that our analysis may not factor in the latest price-sensitive company announcements or qualitative material. Simply Wall St has no position in any stocks mentioned.
Have feedback on this article? Concerned about the content? Get in touch with us directly. Alternatively, email editorial-team@simplywallst.com
