
 Yahoo Finance
 June 2024 Spotlight On Japanese Exchange Growth Companies With High Insider Ownership
Amid a backdrop of mixed weekly returns and heightened focus on monetary policy normalization in Japan, investors continue to seek stable growth opportunities. High insider ownership is often regarded as a positive indicator of confidence in a company's future, making such stocks potentially attractive in the current market environment.
Top 10 Growth Companies With High Insider Ownership In Japan
Name | Insider Ownership | Earnings Growth |
SHIFT (TSE:3697) | 35.4% | 27.2% |
Kanamic NetworkLTD (TSE:3939) | 25% | 28.9% |
Hottolink (TSE:3680) | 27% | 57.3% |
Medley (TSE:4480) | 34% | 28.8% |
Micronics Japan (TSE:6871) | 15.3% | 39.7% |
Kasumigaseki CapitalLtd (TSE:3498) | 34.8% | 44.6% |
ExaWizards (TSE:4259) | 24.8% | 80.2% |
Money Forward (TSE:3994) | 21.4% | 63.6% |
Soiken Holdings (TSE:2385) | 19.8% | 118.4% |
Soracom (TSE:147A) | 17.2% | 54.1% |
Let's dive into some prime choices out of from the screener.
Mercari
Simply Wall St Growth Rating: ★★★★☆☆
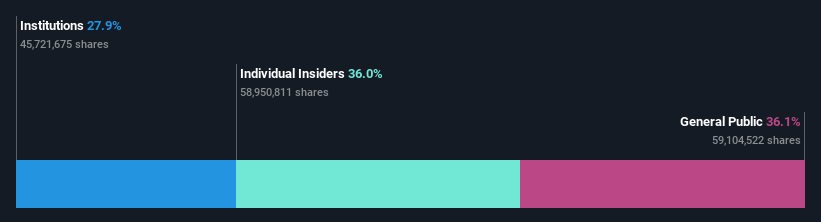
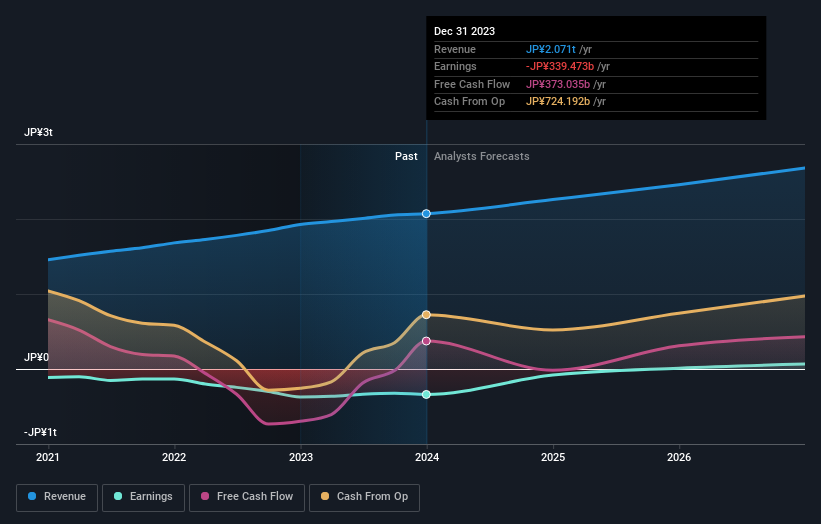
Overview: Mercari, Inc. operates a marketplace application in Japan and the United States, focusing on buying and selling a wide range of products, with a market capitalization of approximately ¥343.60 billion.
Operations: The company generates revenue primarily from its marketplace applications active in Japan and the U.S.
Insider Ownership: 36%
Mercari, a Japanese growth company with high insider ownership, is navigating a dynamic market landscape. Despite its earnings growing by 222.8% over the past year and forecasts suggesting an annual earnings increase of 19.14%, its revenue growth at 9.9% per year lags behind the significant mark of 20%. However, this rate still outpaces the broader Japanese market's growth. Recent strategic moves include eliminating selling fees to disrupt standard industry practices, potentially boosting user engagement and marketplace activity but introducing volatility in its share price and financial stability.
Get an in-depth perspective on Mercari's performance by reading our analyst estimates report here.
Our expertly prepared valuation report Mercari implies its share price may be too high.
Rakuten Group
Simply Wall St Growth Rating: ★★★★☆☆
Overview: Rakuten Group, Inc. operates in e-commerce, fintech, digital content, and communications sectors globally and has a market capitalization of approximately ¥1.78 trillion.
Operations: The company generates revenue through its diverse operations in online retail, financial services, digital media, and telecommunications.
Insider Ownership: 17.3%
Rakuten Group, a Japanese growth company with high insider ownership, is poised for notable changes. Recently completing a $1.99 billion fixed-income offering and forecasting double-digit growth in 2024 excluding its securities business, the company is trading at 78.1% below its estimated fair value. Despite slower than desired revenue growth at 7.4% annually, it's still above Japan's market average of 4%. However, challenges remain as it seeks profitability within three years amidst modest revenue increases and an underwhelming forecasted return on equity of 8.8%.
Capcom
Simply Wall St Growth Rating: ★★★★☆☆
Overview: Capcom Co., Ltd. is a Japanese company that plans, develops, manufactures, sells, and distributes home video games, online games, mobile games, and arcade games globally with a market capitalization of approximately ¥1.28 trillion.
Operations: The company generates revenue through the planning, development, manufacturing, sale, and distribution of home video games, online games, mobile games, and arcade games both in Japan and internationally.
Insider Ownership: 11.5%
Capcom, a Japanese growth company with significant insider ownership, reported an 18.1% increase in earnings last year. While its revenue growth at 5.8% annually is modest, it still surpasses the Japanese market average of 4%. The company's earnings are expected to grow by 8.75% annually, slightly ahead of the market's 8.6%. Despite these gains, Capcom's forecasted Return on Equity is a robust 20.7%, indicating efficient management and potential for sustainable profitability.
Click here and access our complete growth analysis report to understand the dynamics of Capcom.
Our valuation report here indicates Capcom may be overvalued.

Taking Advantage
Unlock our comprehensive list of 105 Fast Growing Japanese Companies With High Insider Ownership by clicking here.
Are you invested in these stocks already? Keep abreast of every twist and turn by setting up a portfolio with Simply Wall St, where we make it simple for investors like you to stay informed and proactive.
Invest smarter with the free Simply Wall St app providing detailed insights into every stock market around the globe.
Looking For Alternative Opportunities?
Explore high-performing small cap companies that haven't yet garnered significant analyst attention.
Diversify your portfolio with solid dividend payers offering reliable income streams to weather potential market turbulence.
Find companies with promising cash flow potential yet trading below their fair value.
This article by Simply Wall St is general in nature. We provide commentary based on historical data and analyst forecasts only using an unbiased methodology and our articles are not intended to be financial advice. It does not constitute a recommendation to buy or sell any stock, and does not take account of your objectives, or your financial situation. We aim to bring you long-term focused analysis driven by fundamental data. Note that our analysis may not factor in the latest price-sensitive company announcements or qualitative material. Simply Wall St has no position in any stocks mentioned.The analysis only considers stock directly held by insiders. It does not include indirectly owned stock through other vehicles such as corporate and/or trust entities. All forecast revenue and earnings growth rates quoted are in terms of annualised (per annum) growth rates over 1-3 years.
Companies discussed in this article include TSE:4385 TSE:4755 and TSE:9697.
Have feedback on this article? Concerned about the content? Get in touch with us directly. Alternatively, email editorial-team@simplywallst.com
