
 Yahoo Finance
 Jet2's (LON:JET2) Returns Have Hit A Wall
If you're not sure where to start when looking for the next multi-bagger, there are a few key trends you should keep an eye out for. Firstly, we'll want to see a proven return on capital employed (ROCE) that is increasing, and secondly, an expanding base of capital employed. Put simply, these types of businesses are compounding machines, meaning they are continually reinvesting their earnings at ever-higher rates of return. That's why when we briefly looked at Jet2's (LON:JET2) ROCE trend, we were pretty happy with what we saw.
Understanding Return On Capital Employed (ROCE)
If you haven't worked with ROCE before, it measures the 'return' (pre-tax profit) a company generates from capital employed in its business. Analysts use this formula to calculate it for Jet2:
Return on Capital Employed = Earnings Before Interest and Tax (EBIT) ÷ (Total Assets - Current Liabilities)
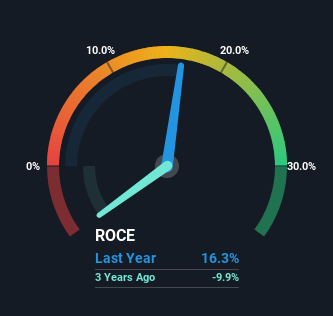
0.16 = UK£494m ÷ (UK£5.3b - UK£2.2b) (Based on the trailing twelve months to September 2023).
Therefore, Jet2 has an ROCE of 16%. On its own, that's a standard return, however it's much better than the 11% generated by the Airlines industry.
View our latest analysis for Jet2
Above you can see how the current ROCE for Jet2 compares to its prior returns on capital, but there's only so much you can tell from the past. If you'd like, you can check out the forecasts from the analysts covering Jet2 for free.
What Does the ROCE Trend For Jet2 Tell Us?
While the current returns on capital are decent, they haven't changed much. Over the past five years, ROCE has remained relatively flat at around 16% and the business has deployed 66% more capital into its operations. 16% is a pretty standard return, and it provides some comfort knowing that Jet2 has consistently earned this amount. Over long periods of time, returns like these might not be too exciting, but with consistency they can pay off in terms of share price returns.
On a separate but related note, it's important to know that Jet2 has a current liabilities to total assets ratio of 42%, which we'd consider pretty high. This effectively means that suppliers (or short-term creditors) are funding a large portion of the business, so just be aware that this can introduce some elements of risk. Ideally we'd like to see this reduce as that would mean fewer obligations bearing risks.
In Conclusion...
To sum it up, Jet2 has simply been reinvesting capital steadily, at those decent rates of return. Therefore it's no surprise that shareholders have earned a respectable 49% return if they held over the last five years. So even though the stock might be more "expensive" than it was before, we think the strong fundamentals warrant this stock for further research.
Jet2 could be trading at an attractive price in other respects, so you might find our free intrinsic value estimation for JET2 on our platform quite valuable.
For those who like to invest in solid companies, check out this free list of companies with solid balance sheets and high returns on equity.
Have feedback on this article? Concerned about the content? Get in touch with us directly. Alternatively, email editorial-team (at) simplywallst.com.
This article by Simply Wall St is general in nature. We provide commentary based on historical data and analyst forecasts only using an unbiased methodology and our articles are not intended to be financial advice. It does not constitute a recommendation to buy or sell any stock, and does not take account of your objectives, or your financial situation. We aim to bring you long-term focused analysis driven by fundamental data. Note that our analysis may not factor in the latest price-sensitive company announcements or qualitative material. Simply Wall St has no position in any stocks mentioned.
