
 Yahoo Finance
 J Sainsbury plc's (LON:SBRY) Fundamentals Look Pretty Strong: Could The Market Be Wrong About The Stock?
With its stock down 8.9% over the past month, it is easy to disregard J Sainsbury (LON:SBRY). However, the company's fundamentals look pretty decent, and long-term financials are usually aligned with future market price movements. Specifically, we decided to study J Sainsbury's ROE in this article.
Return on equity or ROE is an important factor to be considered by a shareholder because it tells them how effectively their capital is being reinvested. Put another way, it reveals the company's success at turning shareholder investments into profits.
See our latest analysis for J Sainsbury
How Do You Calculate Return On Equity?
Return on equity can be calculated by using the formula:
Return on Equity = Net Profit (from continuing operations) ÷ Shareholders' Equity
So, based on the above formula, the ROE for J Sainsbury is:
2.0% = UK£137m ÷ UK£6.9b (Based on the trailing twelve months to March 2024).
The 'return' is the profit over the last twelve months. So, this means that for every £1 of its shareholder's investments, the company generates a profit of £0.02.
What Is The Relationship Between ROE And Earnings Growth?
Thus far, we have learned that ROE measures how efficiently a company is generating its profits. Depending on how much of these profits the company reinvests or "retains", and how effectively it does so, we are then able to assess a company’s earnings growth potential. Assuming everything else remains unchanged, the higher the ROE and profit retention, the higher the growth rate of a company compared to companies that don't necessarily bear these characteristics.
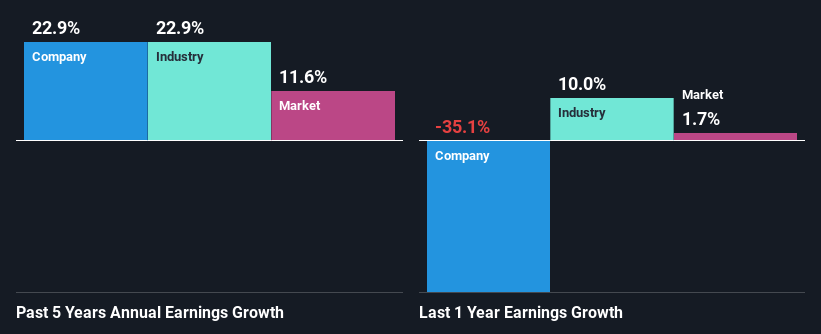
A Side By Side comparison of J Sainsbury's Earnings Growth And 2.0% ROE
It is quite clear that J Sainsbury's ROE is rather low. Even compared to the average industry ROE of 15%, the company's ROE is quite dismal. In spite of this, J Sainsbury was able to grow its net income considerably, at a rate of 23% in the last five years. We reckon that there could be other factors at play here. For example, it is possible that the company's management has made some good strategic decisions, or that the company has a low payout ratio.
We then performed a comparison between J Sainsbury's net income growth with the industry, which revealed that the company's growth is similar to the average industry growth of 23% in the same 5-year period.
Earnings growth is a huge factor in stock valuation. The investor should try to establish if the expected growth or decline in earnings, whichever the case may be, is priced in. By doing so, they will have an idea if the stock is headed into clear blue waters or if swampy waters await. One good indicator of expected earnings growth is the P/E ratio which determines the price the market is willing to pay for a stock based on its earnings prospects. So, you may want to check if J Sainsbury is trading on a high P/E or a low P/E, relative to its industry.
Is J Sainsbury Using Its Retained Earnings Effectively?
The high three-year median payout ratio of 79% (implying that it keeps only 21% of profits) for J Sainsbury suggests that the company's growth wasn't really hampered despite it returning most of the earnings to its shareholders.
Additionally, J Sainsbury has paid dividends over a period of at least ten years which means that the company is pretty serious about sharing its profits with shareholders. Existing analyst estimates suggest that the company's future payout ratio is expected to drop to 57% over the next three years. The fact that the company's ROE is expected to rise to 8.0% over the same period is explained by the drop in the payout ratio.
Conclusion
On the whole, we do feel that J Sainsbury has some positive attributes. That is, quite an impressive growth in earnings. However, the low profit retention means that the company's earnings growth could have been higher, had it been reinvesting a higher portion of its profits. On studying current analyst estimates, we found that analysts expect the company to continue its recent growth streak. To know more about the company's future earnings growth forecasts take a look at this free report on analyst forecasts for the company to find out more.
Have feedback on this article? Concerned about the content? Get in touch with us directly. Alternatively, email editorial-team (at) simplywallst.com.
This article by Simply Wall St is general in nature. We provide commentary based on historical data and analyst forecasts only using an unbiased methodology and our articles are not intended to be financial advice. It does not constitute a recommendation to buy or sell any stock, and does not take account of your objectives, or your financial situation. We aim to bring you long-term focused analysis driven by fundamental data. Note that our analysis may not factor in the latest price-sensitive company announcements or qualitative material. Simply Wall St has no position in any stocks mentioned.
Have feedback on this article? Concerned about the content? Get in touch with us directly. Alternatively, email editorial-team@simplywallst.com
