
 Yahoo Finance
 Investors Will Want Optiva's (TSE:OPT) Growth In ROCE To Persist
If we want to find a potential multi-bagger, often there are underlying trends that can provide clues. In a perfect world, we'd like to see a company investing more capital into its business and ideally the returns earned from that capital are also increasing. This shows us that it's a compounding machine, able to continually reinvest its earnings back into the business and generate higher returns. So on that note, Optiva (TSE:OPT) looks quite promising in regards to its trends of return on capital.
What Is Return On Capital Employed (ROCE)?
If you haven't worked with ROCE before, it measures the 'return' (pre-tax profit) a company generates from capital employed in its business. To calculate this metric for Optiva, this is the formula:
Return on Capital Employed = Earnings Before Interest and Tax (EBIT) ÷ (Total Assets - Current Liabilities)
0.013 = US$928k ÷ (US$86m - US$17m) (Based on the trailing twelve months to September 2023).
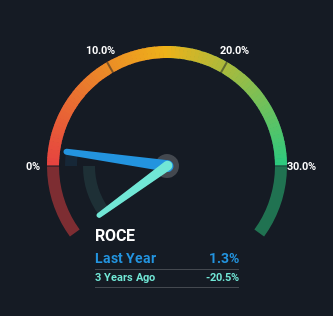
So, Optiva has an ROCE of 1.3%. In absolute terms, that's a low return and it also under-performs the Software industry average of 7.1%.
Check out our latest analysis for Optiva
Above you can see how the current ROCE for Optiva compares to its prior returns on capital, but there's only so much you can tell from the past. If you'd like, you can check out the forecasts from the analysts covering Optiva here for free.
What Can We Tell From Optiva's ROCE Trend?
Optiva has broken into the black (profitability) and we're sure it's a sight for sore eyes. The company now earns 1.3% on its capital, because five years ago it was incurring losses. On top of that, what's interesting is that the amount of capital being employed has remained steady, so the business hasn't needed to put any additional money to work to generate these higher returns. With no noticeable increase in capital employed, it's worth knowing what the company plans on doing going forward in regards to reinvesting and growing the business. So if you're looking for high growth, you'll want to see a business's capital employed also increasing.
One more thing to note, Optiva has decreased current liabilities to 19% of total assets over this period, which effectively reduces the amount of funding from suppliers or short-term creditors. So shareholders would be pleased that the growth in returns has mostly come from underlying business performance.
The Bottom Line On Optiva's ROCE
To bring it all together, Optiva has done well to increase the returns it's generating from its capital employed. And since the stock has dived 95% over the last five years, there may be other factors affecting the company's prospects. In any case, we believe the economic trends of this company are positive and looking into the stock further could prove rewarding.
Optiva does have some risks, we noticed 3 warning signs (and 2 which don't sit too well with us) we think you should know about.
While Optiva isn't earning the highest return, check out this free list of companies that are earning high returns on equity with solid balance sheets.
Have feedback on this article? Concerned about the content? Get in touch with us directly. Alternatively, email editorial-team (at) simplywallst.com.
This article by Simply Wall St is general in nature. We provide commentary based on historical data and analyst forecasts only using an unbiased methodology and our articles are not intended to be financial advice. It does not constitute a recommendation to buy or sell any stock, and does not take account of your objectives, or your financial situation. We aim to bring you long-term focused analysis driven by fundamental data. Note that our analysis may not factor in the latest price-sensitive company announcements or qualitative material. Simply Wall St has no position in any stocks mentioned.
