
 Yahoo Finance
 Investors Will Want Marsden Maritime Holdings' (NZSE:MMH) Growth In ROCE To Persist
If you're not sure where to start when looking for the next multi-bagger, there are a few key trends you should keep an eye out for. In a perfect world, we'd like to see a company investing more capital into its business and ideally the returns earned from that capital are also increasing. Basically this means that a company has profitable initiatives that it can continue to reinvest in, which is a trait of a compounding machine. So when we looked at Marsden Maritime Holdings (NZSE:MMH) and its trend of ROCE, we really liked what we saw.
Return On Capital Employed (ROCE): What Is It?
Just to clarify if you're unsure, ROCE is a metric for evaluating how much pre-tax income (in percentage terms) a company earns on the capital invested in its business. Analysts use this formula to calculate it for Marsden Maritime Holdings:
Return on Capital Employed = Earnings Before Interest and Tax (EBIT) ÷ (Total Assets - Current Liabilities)
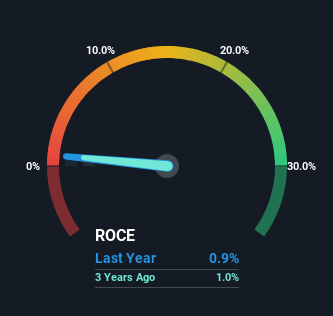
0.009 = NZ$1.8m ÷ (NZ$196m - NZ$754k) (Based on the trailing twelve months to December 2023).
Thus, Marsden Maritime Holdings has an ROCE of 0.9%. In absolute terms, that's a low return and it also under-performs the Infrastructure industry average of 3.8%.
View our latest analysis for Marsden Maritime Holdings
While the past is not representative of the future, it can be helpful to know how a company has performed historically, which is why we have this chart above. If you want to delve into the historical earnings , check out these free graphs detailing revenue and cash flow performance of Marsden Maritime Holdings.
So How Is Marsden Maritime Holdings' ROCE Trending?
We're glad to see that ROCE is heading in the right direction, even if it is still low at the moment. The data shows that returns on capital have increased substantially over the last five years to 0.9%. The amount of capital employed has increased too, by 36%. This can indicate that there's plenty of opportunities to invest capital internally and at ever higher rates, a combination that's common among multi-baggers.
The Bottom Line
A company that is growing its returns on capital and can consistently reinvest in itself is a highly sought after trait, and that's what Marsden Maritime Holdings has. Astute investors may have an opportunity here because the stock has declined 18% in the last five years. That being the case, research into the company's current valuation metrics and future prospects seems fitting.
If you want to continue researching Marsden Maritime Holdings, you might be interested to know about the 2 warning signs that our analysis has discovered.
If you want to search for solid companies with great earnings, check out this free list of companies with good balance sheets and impressive returns on equity.
Have feedback on this article? Concerned about the content? Get in touch with us directly. Alternatively, email editorial-team (at) simplywallst.com.
This article by Simply Wall St is general in nature. We provide commentary based on historical data and analyst forecasts only using an unbiased methodology and our articles are not intended to be financial advice. It does not constitute a recommendation to buy or sell any stock, and does not take account of your objectives, or your financial situation. We aim to bring you long-term focused analysis driven by fundamental data. Note that our analysis may not factor in the latest price-sensitive company announcements or qualitative material. Simply Wall St has no position in any stocks mentioned.
