
 Yahoo Finance
 Investors Will Want Hovnanian Enterprises' (NYSE:HOV) Growth In ROCE To Persist
If we want to find a stock that could multiply over the long term, what are the underlying trends we should look for? One common approach is to try and find a company with returns on capital employed (ROCE) that are increasing, in conjunction with a growing amount of capital employed. This shows us that it's a compounding machine, able to continually reinvest its earnings back into the business and generate higher returns. With that in mind, we've noticed some promising trends at Hovnanian Enterprises (NYSE:HOV) so let's look a bit deeper.
Return On Capital Employed (ROCE): What Is It?
For those that aren't sure what ROCE is, it measures the amount of pre-tax profits a company can generate from the capital employed in its business. To calculate this metric for Hovnanian Enterprises, this is the formula:
Return on Capital Employed = Earnings Before Interest and Tax (EBIT) ÷ (Total Assets - Current Liabilities)
0.15 = US$288m ÷ (US$2.3b - US$456m) (Based on the trailing twelve months to April 2024).
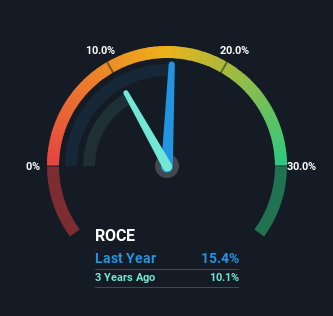
Thus, Hovnanian Enterprises has an ROCE of 15%. By itself that's a normal return on capital and it's in line with the industry's average returns of 15%.
Check out our latest analysis for Hovnanian Enterprises
While the past is not representative of the future, it can be helpful to know how a company has performed historically, which is why we have this chart above. If you're interested in investigating Hovnanian Enterprises' past further, check out this free graph covering Hovnanian Enterprises' past earnings, revenue and cash flow.
What The Trend Of ROCE Can Tell Us
Hovnanian Enterprises is showing promise given that its ROCE is trending up and to the right. More specifically, while the company has kept capital employed relatively flat over the last five years, the ROCE has climbed 400% in that same time. So our take on this is that the business has increased efficiencies to generate these higher returns, all the while not needing to make any additional investments. On that front, things are looking good so it's worth exploring what management has said about growth plans going forward.
The Bottom Line On Hovnanian Enterprises' ROCE
In summary, we're delighted to see that Hovnanian Enterprises has been able to increase efficiencies and earn higher rates of return on the same amount of capital. Since the stock has returned a staggering 2,036% to shareholders over the last five years, it looks like investors are recognizing these changes. In light of that, we think it's worth looking further into this stock because if Hovnanian Enterprises can keep these trends up, it could have a bright future ahead.
On a final note, we've found 2 warning signs for Hovnanian Enterprises that we think you should be aware of.
If you want to search for solid companies with great earnings, check out this free list of companies with good balance sheets and impressive returns on equity.
Have feedback on this article? Concerned about the content? Get in touch with us directly. Alternatively, email editorial-team (at) simplywallst.com.
This article by Simply Wall St is general in nature. We provide commentary based on historical data and analyst forecasts only using an unbiased methodology and our articles are not intended to be financial advice. It does not constitute a recommendation to buy or sell any stock, and does not take account of your objectives, or your financial situation. We aim to bring you long-term focused analysis driven by fundamental data. Note that our analysis may not factor in the latest price-sensitive company announcements or qualitative material. Simply Wall St has no position in any stocks mentioned.
Have feedback on this article? Concerned about the content? Get in touch with us directly. Alternatively, email editorial-team@simplywallst.com
