
 Yahoo Finance
 Investors Will Want Cardinal Energy's (TSE:CJ) Growth In ROCE To Persist
If you're not sure where to start when looking for the next multi-bagger, there are a few key trends you should keep an eye out for. Amongst other things, we'll want to see two things; firstly, a growing return on capital employed (ROCE) and secondly, an expansion in the company's amount of capital employed. If you see this, it typically means it's a company with a great business model and plenty of profitable reinvestment opportunities. Speaking of which, we noticed some great changes in Cardinal Energy's (TSE:CJ) returns on capital, so let's have a look.
What Is Return On Capital Employed (ROCE)?
For those who don't know, ROCE is a measure of a company's yearly pre-tax profit (its return), relative to the capital employed in the business. Analysts use this formula to calculate it for Cardinal Energy:
Return on Capital Employed = Earnings Before Interest and Tax (EBIT) ÷ (Total Assets - Current Liabilities)
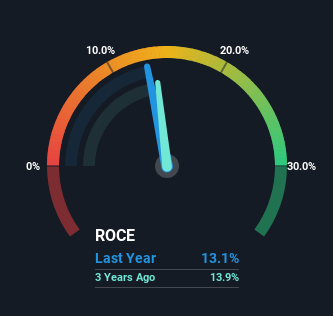
0.13 = CA$146m ÷ (CA$1.2b - CA$112m) (Based on the trailing twelve months to March 2024).
Thus, Cardinal Energy has an ROCE of 13%. On its own, that's a standard return, however it's much better than the 8.5% generated by the Oil and Gas industry.
View our latest analysis for Cardinal Energy
Above you can see how the current ROCE for Cardinal Energy compares to its prior returns on capital, but there's only so much you can tell from the past. If you'd like, you can check out the forecasts from the analysts covering Cardinal Energy for free.
So How Is Cardinal Energy's ROCE Trending?
Cardinal Energy is showing promise given that its ROCE is trending up and to the right. The figures show that over the last five years, ROCE has grown 55% whilst employing roughly the same amount of capital. Basically the business is generating higher returns from the same amount of capital and that is proof that there are improvements in the company's efficiencies. It's worth looking deeper into this though because while it's great that the business is more efficient, it might also mean that going forward the areas to invest internally for the organic growth are lacking.
The Bottom Line On Cardinal Energy's ROCE
To sum it up, Cardinal Energy is collecting higher returns from the same amount of capital, and that's impressive. And with the stock having performed exceptionally well over the last five years, these patterns are being accounted for by investors. In light of that, we think it's worth looking further into this stock because if Cardinal Energy can keep these trends up, it could have a bright future ahead.
Cardinal Energy does have some risks, we noticed 2 warning signs (and 1 which is significant) we think you should know about.
If you want to search for solid companies with great earnings, check out this free list of companies with good balance sheets and impressive returns on equity.
Have feedback on this article? Concerned about the content? Get in touch with us directly. Alternatively, email editorial-team (at) simplywallst.com.
This article by Simply Wall St is general in nature. We provide commentary based on historical data and analyst forecasts only using an unbiased methodology and our articles are not intended to be financial advice. It does not constitute a recommendation to buy or sell any stock, and does not take account of your objectives, or your financial situation. We aim to bring you long-term focused analysis driven by fundamental data. Note that our analysis may not factor in the latest price-sensitive company announcements or qualitative material. Simply Wall St has no position in any stocks mentioned.
Have feedback on this article? Concerned about the content? Get in touch with us directly. Alternatively, email editorial-team@simplywallst.com
