
 Yahoo Finance
 Investors in Tracsis (LON:TRCS) have seen returns of 20% over the past five years
Tracsis plc (LON:TRCS) shareholders have seen the share price descend 16% over the month. But at least the stock is up over the last five years. However we are not very impressed because the share price is only up 20%, less than the market return of 27%.
Let's take a look at the underlying fundamentals over the longer term, and see if they've been consistent with shareholders returns.
View our latest analysis for Tracsis
To quote Buffett, 'Ships will sail around the world but the Flat Earth Society will flourish. There will continue to be wide discrepancies between price and value in the marketplace...' One imperfect but simple way to consider how the market perception of a company has shifted is to compare the change in the earnings per share (EPS) with the share price movement.
Tracsis' earnings per share are down 9.1% per year, despite strong share price performance over five years.
Since the EPS are down strongly, it seems highly unlikely market participants are looking at EPS to value the company. Given that EPS is down, but the share price is up, it seems clear the market is focussed on other aspects of the business, at the moment.
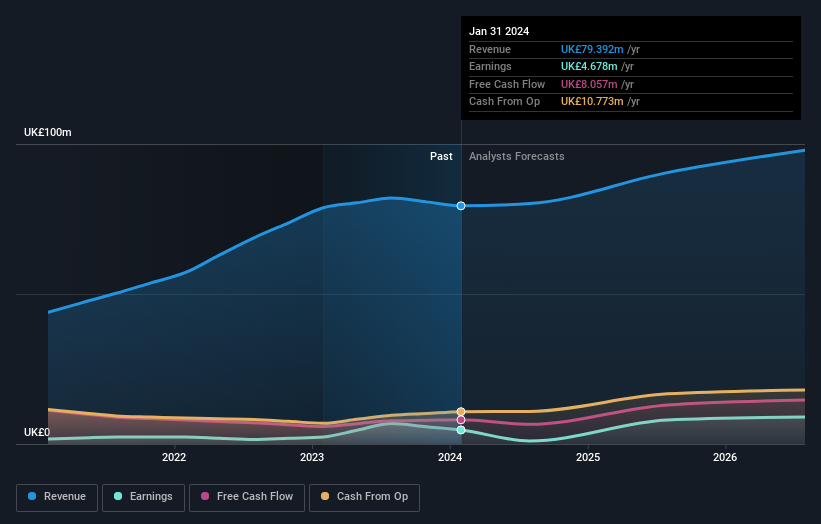
The modest 0.3% dividend yield is unlikely to be propping up the share price. In contrast revenue growth of 14% per year is probably viewed as evidence that Tracsis is growing, a real positive. In that case, the company may be sacrificing current earnings per share to drive growth.
The company's revenue and earnings (over time) are depicted in the image below (click to see the exact numbers).
It is of course excellent to see how Tracsis has grown profits over the years, but the future is more important for shareholders. If you are thinking of buying or selling Tracsis stock, you should check out this FREE detailed report on its balance sheet.
A Different Perspective
Investors in Tracsis had a tough year, with a total loss of 14% (including dividends), against a market gain of about 14%. Even the share prices of good stocks drop sometimes, but we want to see improvements in the fundamental metrics of a business, before getting too interested. Longer term investors wouldn't be so upset, since they would have made 4%, each year, over five years. If the fundamental data continues to indicate long term sustainable growth, the current sell-off could be an opportunity worth considering. Most investors take the time to check the data on insider transactions. You can click here to see if insiders have been buying or selling.
We will like Tracsis better if we see some big insider buys. While we wait, check out this free list of undervalued stocks (mostly small caps) with considerable, recent, insider buying.
Please note, the market returns quoted in this article reflect the market weighted average returns of stocks that currently trade on British exchanges.
Have feedback on this article? Concerned about the content? Get in touch with us directly. Alternatively, email editorial-team (at) simplywallst.com.
This article by Simply Wall St is general in nature. We provide commentary based on historical data and analyst forecasts only using an unbiased methodology and our articles are not intended to be financial advice. It does not constitute a recommendation to buy or sell any stock, and does not take account of your objectives, or your financial situation. We aim to bring you long-term focused analysis driven by fundamental data. Note that our analysis may not factor in the latest price-sensitive company announcements or qualitative material. Simply Wall St has no position in any stocks mentioned.
Have feedback on this article? Concerned about the content? Get in touch with us directly. Alternatively, email editorial-team@simplywallst.com
