
 Yahoo Finance
 Investors three-year losses continue as Sify Technologies (NASDAQ:SIFY) dips a further 42% this week, earnings continue to decline
As an investor, mistakes are inevitable. But really big losses can really drag down an overall portfolio. So consider, for a moment, the misfortune of Sify Technologies Limited (NASDAQ:SIFY) investors who have held the stock for three years as it declined a whopping 72%. That might cause some serious doubts about the merits of the initial decision to buy the stock, to put it mildly. And the ride hasn't got any smoother in recent times over the last year, with the price 33% lower in that time. On top of that, the share price is down 42% in the last week.
After losing 42% this past week, it's worth investigating the company's fundamentals to see what we can infer from past performance.
See our latest analysis for Sify Technologies
To paraphrase Benjamin Graham: Over the short term the market is a voting machine, but over the long term it's a weighing machine. One flawed but reasonable way to assess how sentiment around a company has changed is to compare the earnings per share (EPS) with the share price.
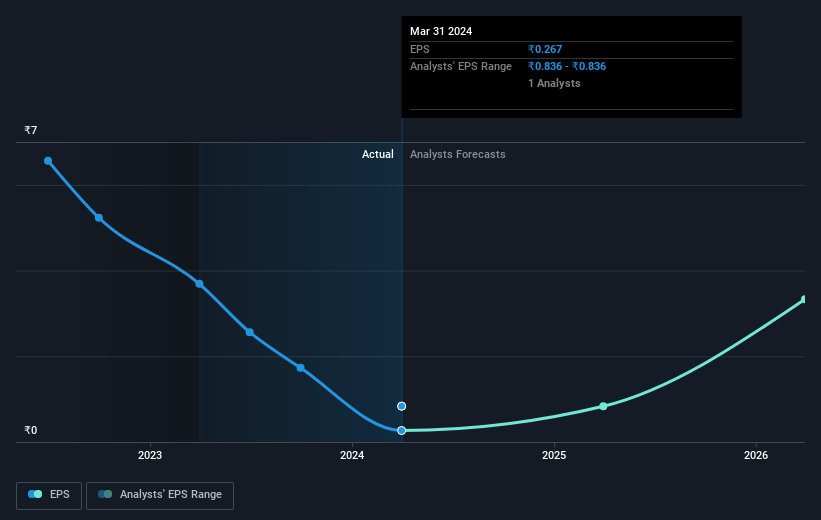
Sify Technologies saw its EPS decline at a compound rate of 68% per year, over the last three years. In comparison the 35% compound annual share price decline isn't as bad as the EPS drop-off. So, despite the prior disappointment, shareholders must have some confidence the situation will improve, longer term. This positive sentiment is also reflected in the generous P/E ratio of 305.97.
You can see below how EPS has changed over time (discover the exact values by clicking on the image).
Before buying or selling a stock, we always recommend a close examination of historic growth trends, available here.
A Different Perspective
While the broader market gained around 24% in the last year, Sify Technologies shareholders lost 33%. However, keep in mind that even the best stocks will sometimes underperform the market over a twelve month period. Regrettably, last year's performance caps off a bad run, with the shareholders facing a total loss of 5% per year over five years. We realise that Baron Rothschild has said investors should "buy when there is blood on the streets", but we caution that investors should first be sure they are buying a high quality business. It's always interesting to track share price performance over the longer term. But to understand Sify Technologies better, we need to consider many other factors. Like risks, for instance. Every company has them, and we've spotted 3 warning signs for Sify Technologies (of which 1 makes us a bit uncomfortable!) you should know about.
But note: Sify Technologies may not be the best stock to buy. So take a peek at this free list of interesting companies with past earnings growth (and further growth forecast).
Please note, the market returns quoted in this article reflect the market weighted average returns of stocks that currently trade on American exchanges.
Have feedback on this article? Concerned about the content? Get in touch with us directly. Alternatively, email editorial-team (at) simplywallst.com.
This article by Simply Wall St is general in nature. We provide commentary based on historical data and analyst forecasts only using an unbiased methodology and our articles are not intended to be financial advice. It does not constitute a recommendation to buy or sell any stock, and does not take account of your objectives, or your financial situation. We aim to bring you long-term focused analysis driven by fundamental data. Note that our analysis may not factor in the latest price-sensitive company announcements or qualitative material. Simply Wall St has no position in any stocks mentioned.
