
 Yahoo Finance
 Investors in St. Joe (NYSE:JOE) have seen solid returns of 243% over the past five years
The worst result, after buying shares in a company (assuming no leverage), would be if you lose all the money you put in. But on the bright side, you can make far more than 100% on a really good stock. For example, the The St. Joe Company (NYSE:JOE) share price has soared 232% in the last half decade. Most would be very happy with that. Then again, the 8.4% share price decline hasn't been so fun for shareholders.
Let's take a look at the underlying fundamentals over the longer term, and see if they've been consistent with shareholders returns.
Check out our latest analysis for St. Joe
To quote Buffett, 'Ships will sail around the world but the Flat Earth Society will flourish. There will continue to be wide discrepancies between price and value in the marketplace...' One imperfect but simple way to consider how the market perception of a company has shifted is to compare the change in the earnings per share (EPS) with the share price movement.
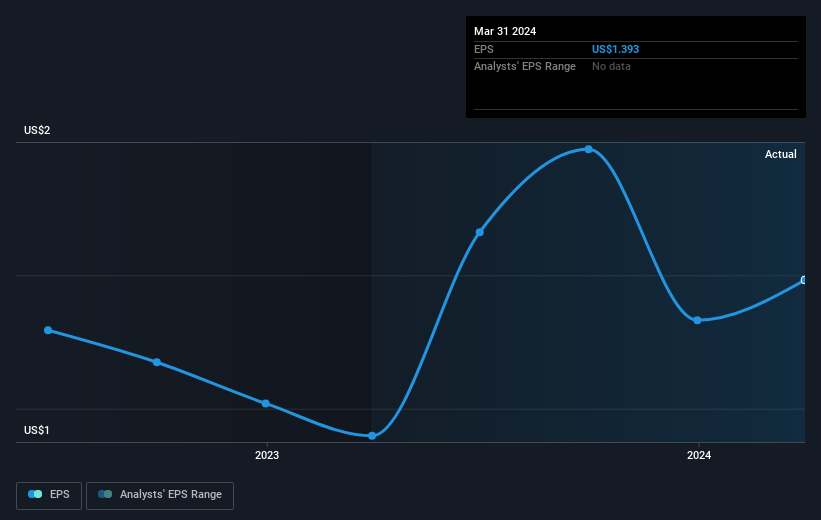
During five years of share price growth, St. Joe achieved compound earnings per share (EPS) growth of 21% per year. This EPS growth is slower than the share price growth of 27% per year, over the same period. So it's fair to assume the market has a higher opinion of the business than it did five years ago. That's not necessarily surprising considering the five-year track record of earnings growth.
The image below shows how EPS has tracked over time (if you click on the image you can see greater detail).
We're pleased to report that the CEO is remunerated more modestly than most CEOs at similarly capitalized companies. It's always worth keeping an eye on CEO pay, but a more important question is whether the company will grow earnings throughout the years. This free interactive report on St. Joe's earnings, revenue and cash flow is a great place to start, if you want to investigate the stock further.
What About Dividends?
When looking at investment returns, it is important to consider the difference between total shareholder return (TSR) and share price return. The TSR incorporates the value of any spin-offs or discounted capital raisings, along with any dividends, based on the assumption that the dividends are reinvested. Arguably, the TSR gives a more comprehensive picture of the return generated by a stock. As it happens, St. Joe's TSR for the last 5 years was 243%, which exceeds the share price return mentioned earlier. This is largely a result of its dividend payments!
A Different Perspective
St. Joe shareholders gained a total return of 18% during the year. But that return falls short of the market. On the bright side, the longer term returns (running at about 28% a year, over half a decade) look better. It may well be that this is a business worth popping on the watching, given the continuing positive reception, over time, from the market. It's always interesting to track share price performance over the longer term. But to understand St. Joe better, we need to consider many other factors. For example, we've discovered 1 warning sign for St. Joe that you should be aware of before investing here.
But note: St. Joe may not be the best stock to buy. So take a peek at this free list of interesting companies with past earnings growth (and further growth forecast).
Please note, the market returns quoted in this article reflect the market weighted average returns of stocks that currently trade on American exchanges.
Have feedback on this article? Concerned about the content? Get in touch with us directly. Alternatively, email editorial-team (at) simplywallst.com.
This article by Simply Wall St is general in nature. We provide commentary based on historical data and analyst forecasts only using an unbiased methodology and our articles are not intended to be financial advice. It does not constitute a recommendation to buy or sell any stock, and does not take account of your objectives, or your financial situation. We aim to bring you long-term focused analysis driven by fundamental data. Note that our analysis may not factor in the latest price-sensitive company announcements or qualitative material. Simply Wall St has no position in any stocks mentioned.
Have feedback on this article? Concerned about the content? Get in touch with us directly. Alternatively, email editorial-team@simplywallst.com
