
 Yahoo Finance
 Investors Shouldn't Overlook Pilbara Minerals' (ASX:PLS) Impressive Returns On Capital
If we want to find a stock that could multiply over the long term, what are the underlying trends we should look for? Amongst other things, we'll want to see two things; firstly, a growing return on capital employed (ROCE) and secondly, an expansion in the company's amount of capital employed. If you see this, it typically means it's a company with a great business model and plenty of profitable reinvestment opportunities. Speaking of which, we noticed some great changes in Pilbara Minerals' (ASX:PLS) returns on capital, so let's have a look.
Return On Capital Employed (ROCE): What Is It?
For those who don't know, ROCE is a measure of a company's yearly pre-tax profit (its return), relative to the capital employed in the business. Analysts use this formula to calculate it for Pilbara Minerals:
Return on Capital Employed = Earnings Before Interest and Tax (EBIT) ÷ (Total Assets - Current Liabilities)
0.47 = AU$1.8b ÷ (AU$4.4b - AU$552m) (Based on the trailing twelve months to December 2023).
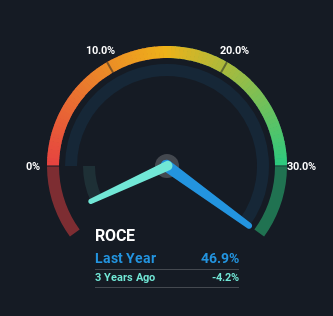
So, Pilbara Minerals has an ROCE of 47%. That's a fantastic return and not only that, it outpaces the average of 10% earned by companies in a similar industry.
View our latest analysis for Pilbara Minerals
In the above chart we have measured Pilbara Minerals' prior ROCE against its prior performance, but the future is arguably more important. If you'd like, you can check out the forecasts from the analysts covering Pilbara Minerals for free.
What Can We Tell From Pilbara Minerals' ROCE Trend?
We're delighted to see that Pilbara Minerals is reaping rewards from its investments and is now generating some pre-tax profits. About five years ago the company was generating losses but things have turned around because it's now earning 47% on its capital. Not only that, but the company is utilizing 705% more capital than before, but that's to be expected from a company trying to break into profitability. We like this trend, because it tells us the company has profitable reinvestment opportunities available to it, and if it continues going forward that can lead to a multi-bagger performance.
In Conclusion...
To the delight of most shareholders, Pilbara Minerals has now broken into profitability. And with the stock having performed exceptionally well over the last five years, these patterns are being accounted for by investors. Therefore, we think it would be worth your time to check if these trends are going to continue.
Like most companies, Pilbara Minerals does come with some risks, and we've found 2 warning signs that you should be aware of.
If you'd like to see other companies earning high returns, check out our free list of companies earning high returns with solid balance sheets here.
Have feedback on this article? Concerned about the content? Get in touch with us directly. Alternatively, email editorial-team (at) simplywallst.com.
This article by Simply Wall St is general in nature. We provide commentary based on historical data and analyst forecasts only using an unbiased methodology and our articles are not intended to be financial advice. It does not constitute a recommendation to buy or sell any stock, and does not take account of your objectives, or your financial situation. We aim to bring you long-term focused analysis driven by fundamental data. Note that our analysis may not factor in the latest price-sensitive company announcements or qualitative material. Simply Wall St has no position in any stocks mentioned.
