
 Yahoo Finance
 Investors Shouldn't Overlook D.R. Horton's (NYSE:DHI) Impressive Returns On Capital
What are the early trends we should look for to identify a stock that could multiply in value over the long term? In a perfect world, we'd like to see a company investing more capital into its business and ideally the returns earned from that capital are also increasing. Ultimately, this demonstrates that it's a business that is reinvesting profits at increasing rates of return. And in light of that, the trends we're seeing at D.R. Horton's (NYSE:DHI) look very promising so lets take a look.
Return On Capital Employed (ROCE): What Is It?
For those who don't know, ROCE is a measure of a company's yearly pre-tax profit (its return), relative to the capital employed in the business. Analysts use this formula to calculate it for D.R. Horton:
Return on Capital Employed = Earnings Before Interest and Tax (EBIT) ÷ (Total Assets - Current Liabilities)
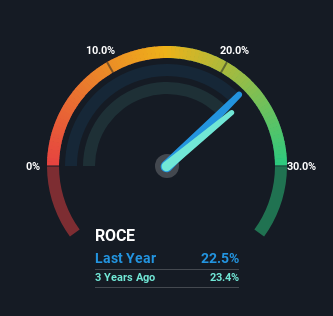
0.23 = US$6.4b ÷ (US$34b - US$5.9b) (Based on the trailing twelve months to March 2024).
So, D.R. Horton has an ROCE of 23%. That's a fantastic return and not only that, it outpaces the average of 15% earned by companies in a similar industry.
Check out our latest analysis for D.R. Horton
Above you can see how the current ROCE for D.R. Horton compares to its prior returns on capital, but there's only so much you can tell from the past. If you're interested, you can view the analysts predictions in our free analyst report for D.R. Horton .
What Can We Tell From D.R. Horton's ROCE Trend?
Investors would be pleased with what's happening at D.R. Horton. The data shows that returns on capital have increased substantially over the last five years to 23%. The company is effectively making more money per dollar of capital used, and it's worth noting that the amount of capital has increased too, by 119%. So we're very much inspired by what we're seeing at D.R. Horton thanks to its ability to profitably reinvest capital.
In Conclusion...
In summary, it's great to see that D.R. Horton can compound returns by consistently reinvesting capital at increasing rates of return, because these are some of the key ingredients of those highly sought after multi-baggers. Since the stock has returned a staggering 221% to shareholders over the last five years, it looks like investors are recognizing these changes. Therefore, we think it would be worth your time to check if these trends are going to continue.
On the other side of ROCE, we have to consider valuation. That's why we have a FREE intrinsic value estimation for DHI on our platform that is definitely worth checking out.
If you want to search for more stocks that have been earning high returns, check out this free list of stocks with solid balance sheets that are also earning high returns on equity.
Have feedback on this article? Concerned about the content? Get in touch with us directly. Alternatively, email editorial-team (at) simplywallst.com.
This article by Simply Wall St is general in nature. We provide commentary based on historical data and analyst forecasts only using an unbiased methodology and our articles are not intended to be financial advice. It does not constitute a recommendation to buy or sell any stock, and does not take account of your objectives, or your financial situation. We aim to bring you long-term focused analysis driven by fundamental data. Note that our analysis may not factor in the latest price-sensitive company announcements or qualitative material. Simply Wall St has no position in any stocks mentioned.
Have feedback on this article? Concerned about the content? Get in touch with us directly. Alternatively, email editorial-team@simplywallst.com
