
 Yahoo Finance
 Investors Met With Slowing Returns on Capital At Parsons (NYSE:PSN)
Finding a business that has the potential to grow substantially is not easy, but it is possible if we look at a few key financial metrics. Firstly, we'd want to identify a growing return on capital employed (ROCE) and then alongside that, an ever-increasing base of capital employed. Put simply, these types of businesses are compounding machines, meaning they are continually reinvesting their earnings at ever-higher rates of return. So, when we ran our eye over Parsons' (NYSE:PSN) trend of ROCE, we liked what we saw.
Understanding Return On Capital Employed (ROCE)
For those who don't know, ROCE is a measure of a company's yearly pre-tax profit (its return), relative to the capital employed in the business. To calculate this metric for Parsons, this is the formula:
Return on Capital Employed = Earnings Before Interest and Tax (EBIT) ÷ (Total Assets - Current Liabilities)
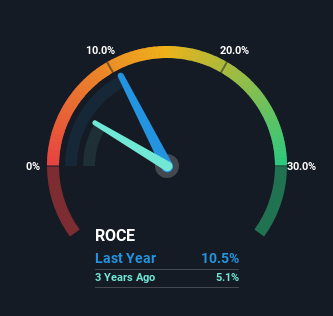
0.10 = US$392m ÷ (US$5.1b - US$1.4b) (Based on the trailing twelve months to March 2024).
Therefore, Parsons has an ROCE of 10%. In isolation, that's a pretty standard return but against the Professional Services industry average of 14%, it's not as good.
Check out our latest analysis for Parsons
In the above chart we have measured Parsons' prior ROCE against its prior performance, but the future is arguably more important. If you'd like to see what analysts are forecasting going forward, you should check out our free analyst report for Parsons .
What Does the ROCE Trend For Parsons Tell Us?
While the returns on capital are good, they haven't moved much. The company has employed 103% more capital in the last five years, and the returns on that capital have remained stable at 10%. Since 10% is a moderate ROCE though, it's good to see a business can continue to reinvest at these decent rates of return. Over long periods of time, returns like these might not be too exciting, but with consistency they can pay off in terms of share price returns.
On a side note, Parsons has done well to reduce current liabilities to 27% of total assets over the last five years. This can eliminate some of the risks inherent in the operations because the business has less outstanding obligations to their suppliers and or short-term creditors than they did previously.
The Bottom Line On Parsons' ROCE
In the end, Parsons has proven its ability to adequately reinvest capital at good rates of return. And the stock has done incredibly well with a 115% return over the last five years, so long term investors are no doubt ecstatic with that result. So while the positive underlying trends may be accounted for by investors, we still think this stock is worth looking into further.
If you'd like to know about the risks facing Parsons, we've discovered 2 warning signs that you should be aware of.
For those who like to invest in solid companies, check out this free list of companies with solid balance sheets and high returns on equity.
Have feedback on this article? Concerned about the content? Get in touch with us directly. Alternatively, email editorial-team (at) simplywallst.com.
This article by Simply Wall St is general in nature. We provide commentary based on historical data and analyst forecasts only using an unbiased methodology and our articles are not intended to be financial advice. It does not constitute a recommendation to buy or sell any stock, and does not take account of your objectives, or your financial situation. We aim to bring you long-term focused analysis driven by fundamental data. Note that our analysis may not factor in the latest price-sensitive company announcements or qualitative material. Simply Wall St has no position in any stocks mentioned.
Have feedback on this article? Concerned about the content? Get in touch with us directly. Alternatively, email editorial-team@simplywallst.com
