
 Yahoo Finance
 Investors Met With Slowing Returns on Capital At Phillips 66 (NYSE:PSX)
If you're not sure where to start when looking for the next multi-bagger, there are a few key trends you should keep an eye out for. In a perfect world, we'd like to see a company investing more capital into its business and ideally the returns earned from that capital are also increasing. Basically this means that a company has profitable initiatives that it can continue to reinvest in, which is a trait of a compounding machine. With that in mind, the ROCE of Phillips 66 (NYSE:PSX) looks decent, right now, so lets see what the trend of returns can tell us.
What Is Return On Capital Employed (ROCE)?
If you haven't worked with ROCE before, it measures the 'return' (pre-tax profit) a company generates from capital employed in its business. To calculate this metric for Phillips 66, this is the formula:
Return on Capital Employed = Earnings Before Interest and Tax (EBIT) ÷ (Total Assets - Current Liabilities)
0.11 = US$6.6b ÷ (US$76b - US$18b) (Based on the trailing twelve months to March 2024).
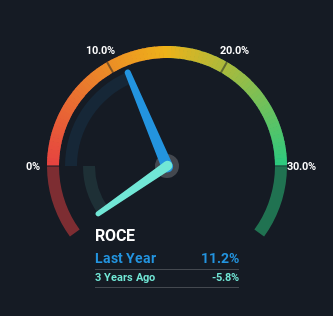
Thus, Phillips 66 has an ROCE of 11%. In absolute terms, that's a pretty normal return, and it's somewhat close to the Oil and Gas industry average of 13%.
Check out our latest analysis for Phillips 66
In the above chart we have measured Phillips 66's prior ROCE against its prior performance, but the future is arguably more important. If you're interested, you can view the analysts predictions in our free analyst report for Phillips 66 .
What Can We Tell From Phillips 66's ROCE Trend?
While the returns on capital are good, they haven't moved much. The company has employed 26% more capital in the last five years, and the returns on that capital have remained stable at 11%. Since 11% is a moderate ROCE though, it's good to see a business can continue to reinvest at these decent rates of return. Over long periods of time, returns like these might not be too exciting, but with consistency they can pay off in terms of share price returns.
Our Take On Phillips 66's ROCE
To sum it up, Phillips 66 has simply been reinvesting capital steadily, at those decent rates of return. Therefore it's no surprise that shareholders have earned a respectable 80% return if they held over the last five years. So while investors seem to be recognizing these promising trends, we still believe the stock deserves further research.
On a final note, we've found 2 warning signs for Phillips 66 that we think you should be aware of.
For those who like to invest in solid companies, check out this free list of companies with solid balance sheets and high returns on equity.
Have feedback on this article? Concerned about the content? Get in touch with us directly. Alternatively, email editorial-team (at) simplywallst.com.
This article by Simply Wall St is general in nature. We provide commentary based on historical data and analyst forecasts only using an unbiased methodology and our articles are not intended to be financial advice. It does not constitute a recommendation to buy or sell any stock, and does not take account of your objectives, or your financial situation. We aim to bring you long-term focused analysis driven by fundamental data. Note that our analysis may not factor in the latest price-sensitive company announcements or qualitative material. Simply Wall St has no position in any stocks mentioned.
Have feedback on this article? Concerned about the content? Get in touch with us directly. Alternatively, email editorial-team@simplywallst.com
