
 Yahoo Finance
 Investors Met With Slowing Returns on Capital At Sime Darby Berhad (KLSE:SIME)
If you're looking for a multi-bagger, there's a few things to keep an eye out for. In a perfect world, we'd like to see a company investing more capital into its business and ideally the returns earned from that capital are also increasing. Put simply, these types of businesses are compounding machines, meaning they are continually reinvesting their earnings at ever-higher rates of return. Having said that, from a first glance at Sime Darby Berhad (KLSE:SIME) we aren't jumping out of our chairs at how returns are trending, but let's have a deeper look.
Return On Capital Employed (ROCE): What Is It?
If you haven't worked with ROCE before, it measures the 'return' (pre-tax profit) a company generates from capital employed in its business. The formula for this calculation on Sime Darby Berhad is:
Return on Capital Employed = Earnings Before Interest and Tax (EBIT) ÷ (Total Assets - Current Liabilities)
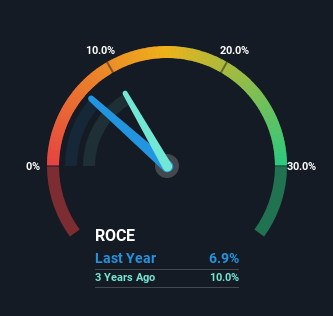
0.069 = RM2.2b ÷ (RM56b - RM24b) (Based on the trailing twelve months to December 2023).
Therefore, Sime Darby Berhad has an ROCE of 6.9%. Even though it's in line with the industry average of 6.8%, it's still a low return by itself.
Check out our latest analysis for Sime Darby Berhad
In the above chart we have measured Sime Darby Berhad's prior ROCE against its prior performance, but the future is arguably more important. If you'd like to see what analysts are forecasting going forward, you should check out our free analyst report for Sime Darby Berhad .
What The Trend Of ROCE Can Tell Us
In terms of Sime Darby Berhad's historical ROCE trend, it doesn't exactly demand attention. Over the past five years, ROCE has remained relatively flat at around 6.9% and the business has deployed 105% more capital into its operations. Given the company has increased the amount of capital employed, it appears the investments that have been made simply don't provide a high return on capital.
On a side note, Sime Darby Berhad's current liabilities are still rather high at 42% of total assets. This effectively means that suppliers (or short-term creditors) are funding a large portion of the business, so just be aware that this can introduce some elements of risk. Ideally we'd like to see this reduce as that would mean fewer obligations bearing risks.
Our Take On Sime Darby Berhad's ROCE
As we've seen above, Sime Darby Berhad's returns on capital haven't increased but it is reinvesting in the business. Although the market must be expecting these trends to improve because the stock has gained 56% over the last five years. But if the trajectory of these underlying trends continue, we think the likelihood of it being a multi-bagger from here isn't high.
On a separate note, we've found 1 warning sign for Sime Darby Berhad you'll probably want to know about.
While Sime Darby Berhad isn't earning the highest return, check out this free list of companies that are earning high returns on equity with solid balance sheets.
Have feedback on this article? Concerned about the content? Get in touch with us directly. Alternatively, email editorial-team (at) simplywallst.com.
This article by Simply Wall St is general in nature. We provide commentary based on historical data and analyst forecasts only using an unbiased methodology and our articles are not intended to be financial advice. It does not constitute a recommendation to buy or sell any stock, and does not take account of your objectives, or your financial situation. We aim to bring you long-term focused analysis driven by fundamental data. Note that our analysis may not factor in the latest price-sensitive company announcements or qualitative material. Simply Wall St has no position in any stocks mentioned.
