
 Yahoo Finance
 Some Investors May Be Worried About TT Electronics' (LON:TTG) Returns On Capital
There are a few key trends to look for if we want to identify the next multi-bagger. Ideally, a business will show two trends; firstly a growing return on capital employed (ROCE) and secondly, an increasing amount of capital employed. Basically this means that a company has profitable initiatives that it can continue to reinvest in, which is a trait of a compounding machine. However, after briefly looking over the numbers, we don't think TT Electronics (LON:TTG) has the makings of a multi-bagger going forward, but let's have a look at why that may be.
Return On Capital Employed (ROCE): What Is It?
For those that aren't sure what ROCE is, it measures the amount of pre-tax profits a company can generate from the capital employed in its business. Analysts use this formula to calculate it for TT Electronics:
Return on Capital Employed = Earnings Before Interest and Tax (EBIT) ÷ (Total Assets - Current Liabilities)
0.021 = UK£10m ÷ (UK£655m - UK£177m) (Based on the trailing twelve months to December 2023).
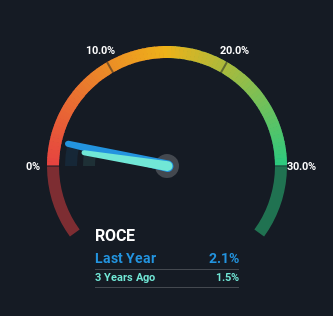
So, TT Electronics has an ROCE of 2.1%. Ultimately, that's a low return and it under-performs the Electronic industry average of 13%.
View our latest analysis for TT Electronics
Above you can see how the current ROCE for TT Electronics compares to its prior returns on capital, but there's only so much you can tell from the past. If you'd like to see what analysts are forecasting going forward, you should check out our free analyst report for TT Electronics .
What Does the ROCE Trend For TT Electronics Tell Us?
In terms of TT Electronics' historical ROCE movements, the trend isn't fantastic. Around five years ago the returns on capital were 4.5%, but since then they've fallen to 2.1%. However it looks like TT Electronics might be reinvesting for long term growth because while capital employed has increased, the company's sales haven't changed much in the last 12 months. It's worth keeping an eye on the company's earnings from here on to see if these investments do end up contributing to the bottom line.
In Conclusion...
Bringing it all together, while we're somewhat encouraged by TT Electronics' reinvestment in its own business, we're aware that returns are shrinking. And investors appear hesitant that the trends will pick up because the stock has fallen 23% in the last five years. On the whole, we aren't too inspired by the underlying trends and we think there may be better chances of finding a multi-bagger elsewhere.
One more thing: We've identified 2 warning signs with TT Electronics (at least 1 which doesn't sit too well with us) , and understanding them would certainly be useful.
While TT Electronics isn't earning the highest return, check out this free list of companies that are earning high returns on equity with solid balance sheets.
Have feedback on this article? Concerned about the content? Get in touch with us directly. Alternatively, email editorial-team (at) simplywallst.com.
This article by Simply Wall St is general in nature. We provide commentary based on historical data and analyst forecasts only using an unbiased methodology and our articles are not intended to be financial advice. It does not constitute a recommendation to buy or sell any stock, and does not take account of your objectives, or your financial situation. We aim to bring you long-term focused analysis driven by fundamental data. Note that our analysis may not factor in the latest price-sensitive company announcements or qualitative material. Simply Wall St has no position in any stocks mentioned.
Have feedback on this article? Concerned about the content? Get in touch with us directly. Alternatively, email editorial-team@simplywallst.com
