
 Yahoo Finance
 Some Investors May Be Worried About Roots' (TSE:ROOT) Returns On Capital
When we're researching a company, it's sometimes hard to find the warning signs, but there are some financial metrics that can help spot trouble early. Typically, we'll see the trend of both return on capital employed (ROCE) declining and this usually coincides with a decreasing amount of capital employed. This indicates the company is producing less profit from its investments and its total assets are decreasing. In light of that, from a first glance at Roots (TSE:ROOT), we've spotted some signs that it could be struggling, so let's investigate.
Understanding Return On Capital Employed (ROCE)
Just to clarify if you're unsure, ROCE is a metric for evaluating how much pre-tax income (in percentage terms) a company earns on the capital invested in its business. Analysts use this formula to calculate it for Roots:
Return on Capital Employed = Earnings Before Interest and Tax (EBIT) ÷ (Total Assets - Current Liabilities)
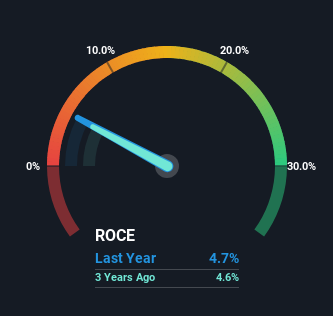
0.047 = CA$15m ÷ (CA$370m - CA$57m) (Based on the trailing twelve months to February 2024).
Therefore, Roots has an ROCE of 4.7%. In absolute terms, that's a low return and it also under-performs the Specialty Retail industry average of 10%.
View our latest analysis for Roots
In the above chart we have measured Roots' prior ROCE against its prior performance, but the future is arguably more important. If you're interested, you can view the analysts predictions in our free analyst report for Roots .
The Trend Of ROCE
We are a bit worried about the trend of returns on capital at Roots. Unfortunately the returns on capital have diminished from the 7.8% that they were earning five years ago. Meanwhile, capital employed in the business has stayed roughly the flat over the period. Since returns are falling and the business has the same amount of assets employed, this can suggest it's a mature business that hasn't had much growth in the last five years. So because these trends aren't typically conducive to creating a multi-bagger, we wouldn't hold our breath on Roots becoming one if things continue as they have.
The Bottom Line On Roots' ROCE
In the end, the trend of lower returns on the same amount of capital isn't typically an indication that we're looking at a growth stock. Long term shareholders who've owned the stock over the last five years have experienced a 34% depreciation in their investment, so it appears the market might not like these trends either. Unless there is a shift to a more positive trajectory in these metrics, we would look elsewhere.
Like most companies, Roots does come with some risks, and we've found 3 warning signs that you should be aware of.
While Roots isn't earning the highest return, check out this free list of companies that are earning high returns on equity with solid balance sheets.
Have feedback on this article? Concerned about the content? Get in touch with us directly. Alternatively, email editorial-team (at) simplywallst.com.
This article by Simply Wall St is general in nature. We provide commentary based on historical data and analyst forecasts only using an unbiased methodology and our articles are not intended to be financial advice. It does not constitute a recommendation to buy or sell any stock, and does not take account of your objectives, or your financial situation. We aim to bring you long-term focused analysis driven by fundamental data. Note that our analysis may not factor in the latest price-sensitive company announcements or qualitative material. Simply Wall St has no position in any stocks mentioned.
