
 Yahoo Finance
 Some Investors May Be Worried About ADM Hamburg's (FRA:OEL) Returns On Capital
What trends should we look for it we want to identify stocks that can multiply in value over the long term? Amongst other things, we'll want to see two things; firstly, a growing return on capital employed (ROCE) and secondly, an expansion in the company's amount of capital employed. If you see this, it typically means it's a company with a great business model and plenty of profitable reinvestment opportunities. However, after investigating ADM Hamburg (FRA:OEL), we don't think it's current trends fit the mold of a multi-bagger.
Return On Capital Employed (ROCE): What Is It?
For those that aren't sure what ROCE is, it measures the amount of pre-tax profits a company can generate from the capital employed in its business. Analysts use this formula to calculate it for ADM Hamburg:
Return on Capital Employed = Earnings Before Interest and Tax (EBIT) ÷ (Total Assets - Current Liabilities)
0.077 = €13m ÷ (€178m - €15m) (Based on the trailing twelve months to June 2023).
Therefore, ADM Hamburg has an ROCE of 7.7%. Ultimately, that's a low return and it under-performs the Food industry average of 13%.
View our latest analysis for ADM Hamburg
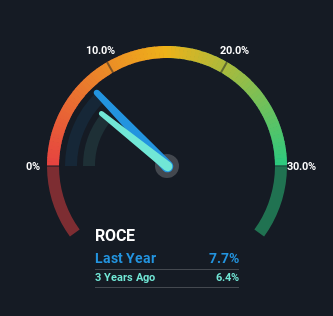
Historical performance is a great place to start when researching a stock so above you can see the gauge for ADM Hamburg's ROCE against it's prior returns. If you want to delve into the historical earnings , check out these free graphs detailing revenue and cash flow performance of ADM Hamburg.
What The Trend Of ROCE Can Tell Us
In terms of ADM Hamburg's historical ROCE movements, the trend isn't fantastic. Over the last five years, returns on capital have decreased to 7.7% from 27% five years ago. Although, given both revenue and the amount of assets employed in the business have increased, it could suggest the company is investing in growth, and the extra capital has led to a short-term reduction in ROCE. If these investments prove successful, this can bode very well for long term stock performance.
On a related note, ADM Hamburg has decreased its current liabilities to 8.4% of total assets. So we could link some of this to the decrease in ROCE. What's more, this can reduce some aspects of risk to the business because now the company's suppliers or short-term creditors are funding less of its operations. Since the business is basically funding more of its operations with it's own money, you could argue this has made the business less efficient at generating ROCE.
The Bottom Line On ADM Hamburg's ROCE
In summary, despite lower returns in the short term, we're encouraged to see that ADM Hamburg is reinvesting for growth and has higher sales as a result. These trends are starting to be recognized by investors since the stock has delivered a 0.4% gain to shareholders who've held over the last five years. So this stock may still be an appealing investment opportunity, if other fundamentals prove to be sound.
One final note, you should learn about the 3 warning signs we've spotted with ADM Hamburg (including 1 which is concerning) .
If you want to search for solid companies with great earnings, check out this free list of companies with good balance sheets and impressive returns on equity.
Have feedback on this article? Concerned about the content? Get in touch with us directly. Alternatively, email editorial-team (at) simplywallst.com.
This article by Simply Wall St is general in nature. We provide commentary based on historical data and analyst forecasts only using an unbiased methodology and our articles are not intended to be financial advice. It does not constitute a recommendation to buy or sell any stock, and does not take account of your objectives, or your financial situation. We aim to bring you long-term focused analysis driven by fundamental data. Note that our analysis may not factor in the latest price-sensitive company announcements or qualitative material. Simply Wall St has no position in any stocks mentioned.
Have feedback on this article? Concerned about the content? Get in touch with us directly. Alternatively, email editorial-team@simplywallst.com
