
 Yahoo Finance
 Investors in Kandi Technologies Group (NASDAQ:KNDI) have unfortunately lost 68% over the last three years
If you love investing in stocks you're bound to buy some losers. But the last three years have been particularly tough on longer term Kandi Technologies Group, Inc. (NASDAQ:KNDI) shareholders. Unfortunately, they have held through a 68% decline in the share price in that time. And over the last year the share price fell 51%, so we doubt many shareholders are delighted. On the other hand the share price has bounced 7.1% over the last week.
With that in mind, it's worth seeing if the company's underlying fundamentals have been the driver of long term performance, or if there are some discrepancies.
Check out our latest analysis for Kandi Technologies Group
Given that Kandi Technologies Group only made minimal earnings in the last twelve months, we'll focus on revenue to gauge its business development. As a general rule, we think this kind of company is more comparable to loss-making stocks, since the actual profit is so low. It would be hard to believe in a more profitable future without growing revenues.
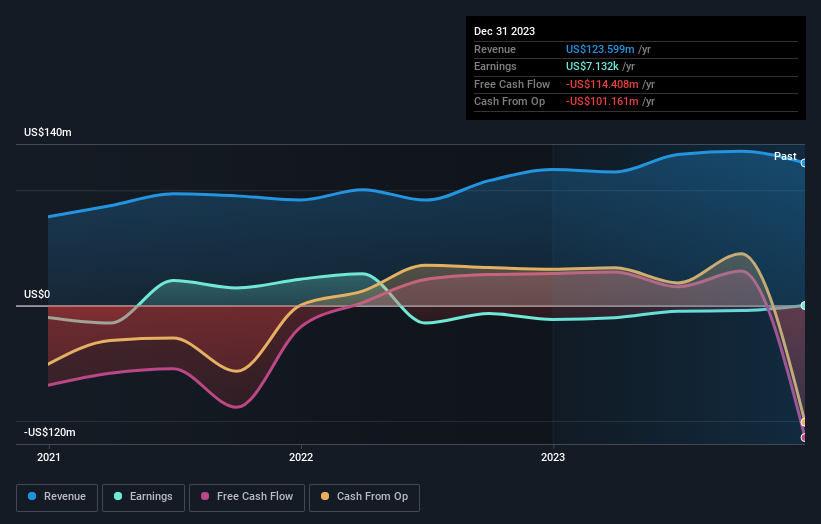
In the last three years, Kandi Technologies Group saw its revenue grow by 16% per year, compound. That's a fairly respectable growth rate. So some shareholders would be frustrated with the compound loss of 19% per year. To be frank we're surprised to see revenue growth and share price growth diverge so strongly. It would be well worth taking a closer look at the company, to determine growth trends (and balance sheet strength).
The graphic below depicts how earnings and revenue have changed over time (unveil the exact values by clicking on the image).
We're pleased to report that the CEO is remunerated more modestly than most CEOs at similarly capitalized companies. It's always worth keeping an eye on CEO pay, but a more important question is whether the company will grow earnings throughout the years. It might be well worthwhile taking a look at our free report on Kandi Technologies Group's earnings, revenue and cash flow.
A Different Perspective
While the broader market gained around 24% in the last year, Kandi Technologies Group shareholders lost 51%. However, keep in mind that even the best stocks will sometimes underperform the market over a twelve month period. Unfortunately, last year's performance may indicate unresolved challenges, given that it was worse than the annualised loss of 10% over the last half decade. Generally speaking long term share price weakness can be a bad sign, though contrarian investors might want to research the stock in hope of a turnaround. It's always interesting to track share price performance over the longer term. But to understand Kandi Technologies Group better, we need to consider many other factors. Consider for instance, the ever-present spectre of investment risk. We've identified 2 warning signs with Kandi Technologies Group (at least 1 which is concerning) , and understanding them should be part of your investment process.
For those who like to find winning investments this free list of undervalued companies with recent insider purchasing, could be just the ticket.
Please note, the market returns quoted in this article reflect the market weighted average returns of stocks that currently trade on American exchanges.
Have feedback on this article? Concerned about the content? Get in touch with us directly. Alternatively, email editorial-team (at) simplywallst.com.
This article by Simply Wall St is general in nature. We provide commentary based on historical data and analyst forecasts only using an unbiased methodology and our articles are not intended to be financial advice. It does not constitute a recommendation to buy or sell any stock, and does not take account of your objectives, or your financial situation. We aim to bring you long-term focused analysis driven by fundamental data. Note that our analysis may not factor in the latest price-sensitive company announcements or qualitative material. Simply Wall St has no position in any stocks mentioned.
Have feedback on this article? Concerned about the content? Get in touch with us directly. Alternatively, email editorial-team@simplywallst.com
