
 Yahoo Finance
 Investors in Inseego (NASDAQ:INSG) from three years ago are still down 90%, even after 18% gain this past week
It is a pleasure to report that the Inseego Corp. (NASDAQ:INSG) is up 268% in the last quarter. But the last three years have seen a terrible decline. To wit, the share price sky-dived 90% in that time. So we're relieved for long term holders to see a bit of uplift. Of course the real question is whether the business can sustain a turnaround. We really hope anyone holding through that price crash has a diversified portfolio. Even when you lose money, you don't have to lose the lesson.
The recent uptick of 18% could be a positive sign of things to come, so let's take a look at historical fundamentals.
See our latest analysis for Inseego
Because Inseego made a loss in the last twelve months, we think the market is probably more focussed on revenue and revenue growth, at least for now. Generally speaking, companies without profits are expected to grow revenue every year, and at a good clip. As you can imagine, fast revenue growth, when maintained, often leads to fast profit growth.
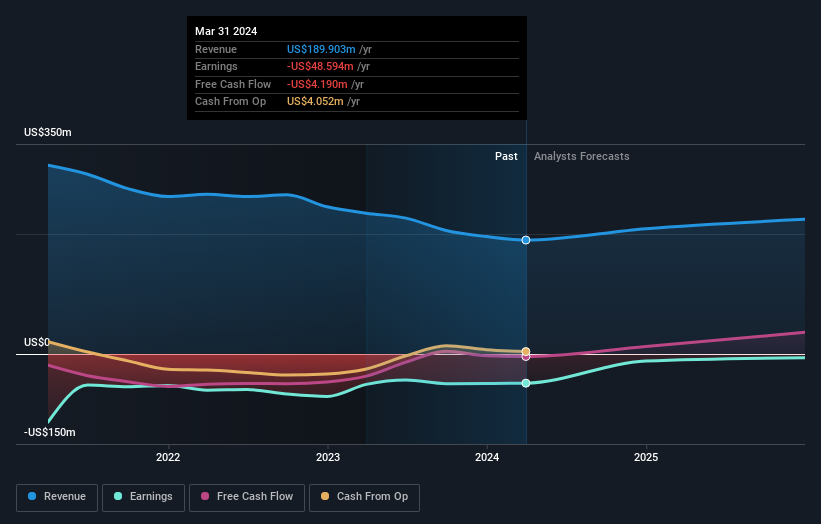
Over the last three years, Inseego's revenue dropped 15% per year. That's definitely a weaker result than most pre-profit companies report. And as you might expect the share price has been weak too, dropping at a rate of 24% per year. We prefer leave it to clowns to try to catch falling knives, like this stock. There is a good reason that investors often describe buying a sharply falling stock price as 'trying to catch a falling knife'. Think about it.
You can see how earnings and revenue have changed over time in the image below (click on the chart to see the exact values).
You can see how its balance sheet has strengthened (or weakened) over time in this free interactive graphic.
A Different Perspective
It's nice to see that Inseego shareholders have received a total shareholder return of 73% over the last year. That certainly beats the loss of about 12% per year over the last half decade. The long term loss makes us cautious, but the short term TSR gain certainly hints at a brighter future. It's always interesting to track share price performance over the longer term. But to understand Inseego better, we need to consider many other factors. For example, we've discovered 4 warning signs for Inseego (2 are potentially serious!) that you should be aware of before investing here.
If you would prefer to check out another company -- one with potentially superior financials -- then do not miss this free list of companies that have proven they can grow earnings.
Please note, the market returns quoted in this article reflect the market weighted average returns of stocks that currently trade on American exchanges.
Have feedback on this article? Concerned about the content? Get in touch with us directly. Alternatively, email editorial-team (at) simplywallst.com.
This article by Simply Wall St is general in nature. We provide commentary based on historical data and analyst forecasts only using an unbiased methodology and our articles are not intended to be financial advice. It does not constitute a recommendation to buy or sell any stock, and does not take account of your objectives, or your financial situation. We aim to bring you long-term focused analysis driven by fundamental data. Note that our analysis may not factor in the latest price-sensitive company announcements or qualitative material. Simply Wall St has no position in any stocks mentioned.
Have feedback on this article? Concerned about the content? Get in touch with us directly. Alternatively, email editorial-team@simplywallst.com
