
 Yahoo Finance
 Investors in HUYA (NYSE:HUYA) have unfortunately lost 81% over the last five years
Some stocks are best avoided. We really hate to see fellow investors lose their hard-earned money. Spare a thought for those who held HUYA Inc. (NYSE:HUYA) for five whole years - as the share price tanked 83%. More recently, the share price has dropped a further 30% in a month. We really hope anyone holding through that price crash has a diversified portfolio. Even when you lose money, you don't have to lose the lesson.
Since shareholders are down over the longer term, lets look at the underlying fundamentals over the that time and see if they've been consistent with returns.
See our latest analysis for HUYA
While markets are a powerful pricing mechanism, share prices reflect investor sentiment, not just underlying business performance. One imperfect but simple way to consider how the market perception of a company has shifted is to compare the change in the earnings per share (EPS) with the share price movement.
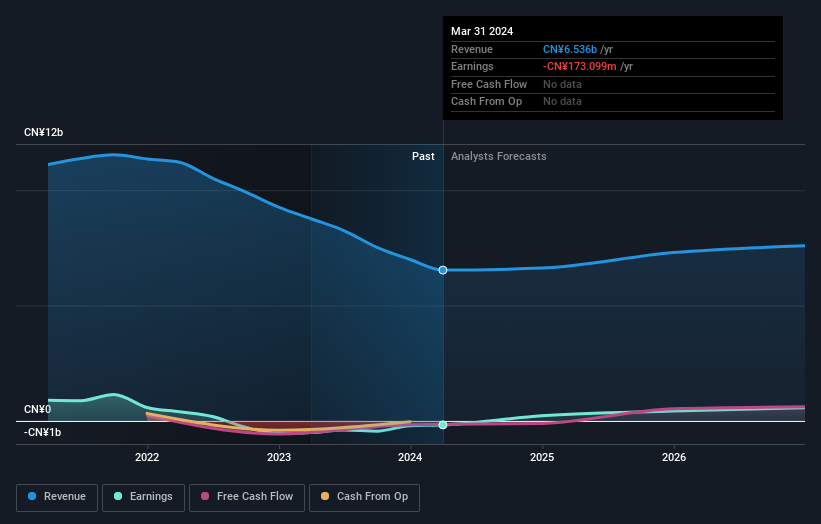
We know that HUYA has been profitable in the past. However, it made a loss in the last twelve months, suggesting profit may be an unreliable metric at this stage. Other metrics may better explain the share price move.
Revenue is actually up 0.5% over the time period. A more detailed examination of the revenue and earnings may or may not explain why the share price languishes; there could be an opportunity.
The graphic below depicts how earnings and revenue have changed over time (unveil the exact values by clicking on the image).
HUYA is a well known stock, with plenty of analyst coverage, suggesting some visibility into future growth. You can see what analysts are predicting for HUYA in this interactive graph of future profit estimates.
What About The Total Shareholder Return (TSR)?
We've already covered HUYA's share price action, but we should also mention its total shareholder return (TSR). Arguably the TSR is a more complete return calculation because it accounts for the value of dividends (as if they were reinvested), along with the hypothetical value of any discounted capital that have been offered to shareholders. HUYA hasn't been paying dividends, but its TSR of -81% exceeds its share price return of -83%, implying it has either spun-off a business, or raised capital at a discount; thereby providing additional value to shareholders.
A Different Perspective
HUYA provided a TSR of 22% over the year. That's fairly close to the broader market return. The silver lining is that the share price is up in the short term, which flies in the face of the annualised loss of 13% over the last five years. While 'turnarounds seldom turn' there are green shoots for HUYA. Shareholders might want to examine this detailed historical graph of past earnings, revenue and cash flow.
If you would prefer to check out another company -- one with potentially superior financials -- then do not miss this free list of companies that have proven they can grow earnings.
Please note, the market returns quoted in this article reflect the market weighted average returns of stocks that currently trade on American exchanges.
Have feedback on this article? Concerned about the content? Get in touch with us directly. Alternatively, email editorial-team (at) simplywallst.com.
This article by Simply Wall St is general in nature. We provide commentary based on historical data and analyst forecasts only using an unbiased methodology and our articles are not intended to be financial advice. It does not constitute a recommendation to buy or sell any stock, and does not take account of your objectives, or your financial situation. We aim to bring you long-term focused analysis driven by fundamental data. Note that our analysis may not factor in the latest price-sensitive company announcements or qualitative material. Simply Wall St has no position in any stocks mentioned.
Have feedback on this article? Concerned about the content? Get in touch with us directly. Alternatively, email editorial-team@simplywallst.com
