
 Yahoo Finance
 Investors in Entergy (NYSE:ETR) have seen respectable returns of 42% over the past five years
When you buy and hold a stock for the long term, you definitely want it to provide a positive return. Better yet, you'd like to see the share price move up more than the market average. But Entergy Corporation (NYSE:ETR) has fallen short of that second goal, with a share price rise of 18% over five years, which is below the market return. Looking at the last year alone, the stock is up 14%.
Now it's worth having a look at the company's fundamentals too, because that will help us determine if the long term shareholder return has matched the performance of the underlying business.
Check out our latest analysis for Entergy
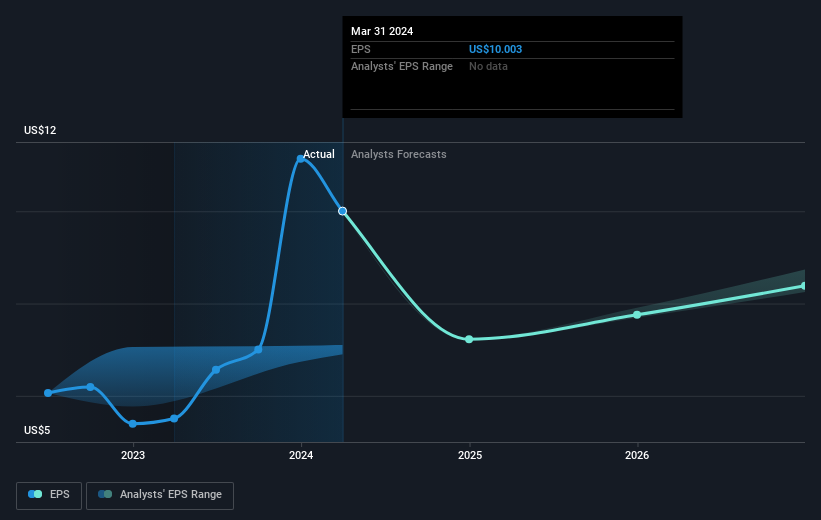
While the efficient markets hypothesis continues to be taught by some, it has been proven that markets are over-reactive dynamic systems, and investors are not always rational. One imperfect but simple way to consider how the market perception of a company has shifted is to compare the change in the earnings per share (EPS) with the share price movement.
Over half a decade, Entergy managed to grow its earnings per share at 13% a year. The EPS growth is more impressive than the yearly share price gain of 3% over the same period. So it seems the market isn't so enthusiastic about the stock these days. This cautious sentiment is reflected in its (fairly low) P/E ratio of 11.50.
You can see how EPS has changed over time in the image below (click on the chart to see the exact values).
We know that Entergy has improved its bottom line lately, but is it going to grow revenue? If you're interested, you could check this free report showing consensus revenue forecasts.
What About Dividends?
When looking at investment returns, it is important to consider the difference between total shareholder return (TSR) and share price return. The TSR incorporates the value of any spin-offs or discounted capital raisings, along with any dividends, based on the assumption that the dividends are reinvested. So for companies that pay a generous dividend, the TSR is often a lot higher than the share price return. We note that for Entergy the TSR over the last 5 years was 42%, which is better than the share price return mentioned above. The dividends paid by the company have thusly boosted the total shareholder return.
A Different Perspective
Entergy shareholders are up 19% for the year (even including dividends). But that return falls short of the market. The silver lining is that the gain was actually better than the average annual return of 7% per year over five year. This suggests the company might be improving over time. It's always interesting to track share price performance over the longer term. But to understand Entergy better, we need to consider many other factors. Consider for instance, the ever-present spectre of investment risk. We've identified 3 warning signs with Entergy (at least 1 which can't be ignored) , and understanding them should be part of your investment process.
Of course Entergy may not be the best stock to buy. So you may wish to see this free collection of growth stocks.
Please note, the market returns quoted in this article reflect the market weighted average returns of stocks that currently trade on American exchanges.
Have feedback on this article? Concerned about the content? Get in touch with us directly. Alternatively, email editorial-team (at) simplywallst.com.
This article by Simply Wall St is general in nature. We provide commentary based on historical data and analyst forecasts only using an unbiased methodology and our articles are not intended to be financial advice. It does not constitute a recommendation to buy or sell any stock, and does not take account of your objectives, or your financial situation. We aim to bring you long-term focused analysis driven by fundamental data. Note that our analysis may not factor in the latest price-sensitive company announcements or qualitative material. Simply Wall St has no position in any stocks mentioned.